Lately, I’ve seen a lot of statistics about the economic consequences of the Syrian Civil War, much of it disturbing evidence as to the scale of the suffering. For example, one report by the Syrian Center for Policy Research (SCPR) published in March 2015 claimed that Syria had lost more $119bn in Gross Domestic Product (GDP) since the outbreak up until 2014, and that “total losses” amounted to $220bn when comparing to a scenario without the conflict. For a country whose GDP in 2007 was valued at $40bn, this represents an enormous dollar loss in Syria’s output.
Another report, published by UNWRA, made the claim that
“[e]ven if the conflict ceased now and GDP grew at an average rate of five per cent each year, it is estimated that it would take the Syrian economy 30 years to return to the economic level of 2010”.
These are all striking ways of describing the economic costs of the Syrian conflict. At the same time, neither the UNWRA report nor the SCPR is very specific about how it arrived at these quoted estimates and so I felt the urge to take a stab at this in my own way, while also expanding the alternative “non-crisis” scenarios a bit more.
As for GDP, there’s a disclaimer to be made about it only being just one measure – an imperfect one, at that – of economic output, and as for measuring living standards, its per capita variant is but one of many candidates, but as GDP remains the quintessential summary of an economy’s productive capacity, it is the focus of this blog post.
Regarding some of the headline statistics mentioned in the news, one of the reason why Syria’s GDP has fallen so much in dollars is because the Syrian Pound has depreciated substantially. Dollar losses thus mix falls in GDP with that of the exchange rate. Most of the GDP-related statistics presented in the above mentioned SCPR report instead focus on real GDP growth in Syrian Pounds. To construct GDP and an alternative non-crisis scenario, the authors use
“actual quantitative proxy indicators, seasonality analysis, econometric projections, and a financial programming model. The report used the counterfactual methodology to estimate the economic loss, where the “crisis scenario” is the estimation of the actual GDP, and the “continuing scenario” is the projection of GDP during the same period using past historical data to project what would have been likely had the crisis not occurred.”
Even thought the SCPR is a fascinating report in many ways, it is not very specific about the methodology (something that can be easily accommodated in future reports by a more detailed methodology section). At the same time, there are few other options for macroeconomic data available for Syria, as the World Development Indicators (WDI) series run only until 2007, and the IMF’s World Economic Outlook (WEO) database only until 2010. Two exceptions are the Conference Board’s Total Economy Database, and the World Bank’s Global Economic Prospects (GEP) annual publication series, which both publish real GDP growth rates for Syria.
With actual GDP of Syria, we can document current output during the crisis compared to how it did before the crisis, say in 2010. But as Syria’s economy was growing before it started, such a measure would understate the loss, and a more accurate estimate of the real loss would take into account what Syria’s GDP would have been in a counterfactual, non-crisis, scenario. For the purpose of this blog posts I will use pre-crisis forecasts by SCPR and IMF as estimates for such scenarios.
As for longer-horizon forecasts, the IMF (at least in published work) appears to have given up trying to forecast Syria’s economy sometime in 2012 due to “the uncertain political situation”. But as the previous years forecasts are over a six-year horizon, the 2010 forecast, done before the crisis started, runs through 2014 and can thus be used as an alternative “counterfactual” scenario to that constructed by the SCPR. This does not necessarily mean that the difference between the observed and the forecasted series represent the causal effect of the Syrian crisis (a composite of the Arab Spring, the civil war, and whatever the Western policy in the country is), but in absence of better identification strategies it offers meaningful alternatives of the Syrian economy as perceived before 2011.
I thus have two types of GDP series available; 1) estimates of actual GDP and 2) forecasts of GDP from before the conflict (IMF) or as-if the conflict hadn’t occurred from SCPR. Among the two, SCPR forecasts real GDP growth at 6.6 percent per year 2010-2014, with the IMF’s World Economic Outlook (WEO) in 2010 forecasting 5.6 percent growth per year for the same period. Both sources forecast Syrian GDP growth above the preceding decade, which was 4.8 percent. As a more conservative candidate I extrapolate past GDP as a third alternative for a non-conflict scenario. (I have no prejudice as to whether the IMF is better or worse than the SCPR one, but what is clear is that both expected Syrian GDP to perform better than it had in the recent past.This is in itself quite interesting, but outside the scope of this post)
For both the series on actual GDP estimates as well as the forecasts, these are undoubtedly fraught with various measurement problems that could fit in (and perhaps deserves) a blog post on its own. Starting off with the IMF’s 2009 Article IV consultation for Syria already complaining about the quality of data and reporting standards, add to that also the question of how reliable statistics for the country is to be collected in the midst of a civil war, when the government controls just half its territory. Moreover, the size of the informal or black market could increase in wartime, and if Syrian government statistics are forced to omit from recording output occurring in rebel-held areas, this could overestimate GDP losses – that is, if the relevant constituency for data collection remains the Syrian state borders as they were in 2010 (and even if we were more interested in just the area controlled by the Syrian government, it would still be unclear whether we’re measuring lower GDP losses as a result of losing territory as opposed to lower output for a given territory because of the crisis.) Neither the Conference Board or the SCPR estimates divulge whether they are estimates for the entire 2010-border state of Syria or exclusively for areas controlled by the government.
The degree to which Syria’s GDP losses could be overestimated would be greater depending on how much output is produced in rebel-held areas. It may be fair to assume that the Syrian government remains in control of the wealthier parts of the country (for example, the government controls a larger share of the population than the share of territory). Notwithstanding, the government’s loss of some oil fields to rebels could be a sign that there is some output unaccounted for, even though any oil output by rebels using Syrian oil fields is likely to receive lower prices (perhaps as sales would probably have to involve smuggling), suffer from lack of skilled workers and – especially if oil fields were severely contested – these could be places with significant destruction of the capital stock and under risk of infighting between rebel factions. But even if those parts of Syria not controlled by the government constitutes more of the economic periphery, or if those resources become significantly less productive, these potential limits in the quality of statistics collection need to be kept in mind.
These considerations aside, the below figure shows the relevant series: the historical IMF series of Syria’s GDP from 1990-2010; the estimates for Syria’s more recent actual GDP from SCPR (solid blue), the Conference Board (solid red line), and the World Bank (solid green line); and the forecasts for Syria’s GDP from SCPR (dashed blue line), the IMF (dashed red line), as well as the trend from the last ten years of the historical IMF series extrapolated to 2014 (dashed gray line). All series are in constant Syrian Pounds, or local currency units (LCU).
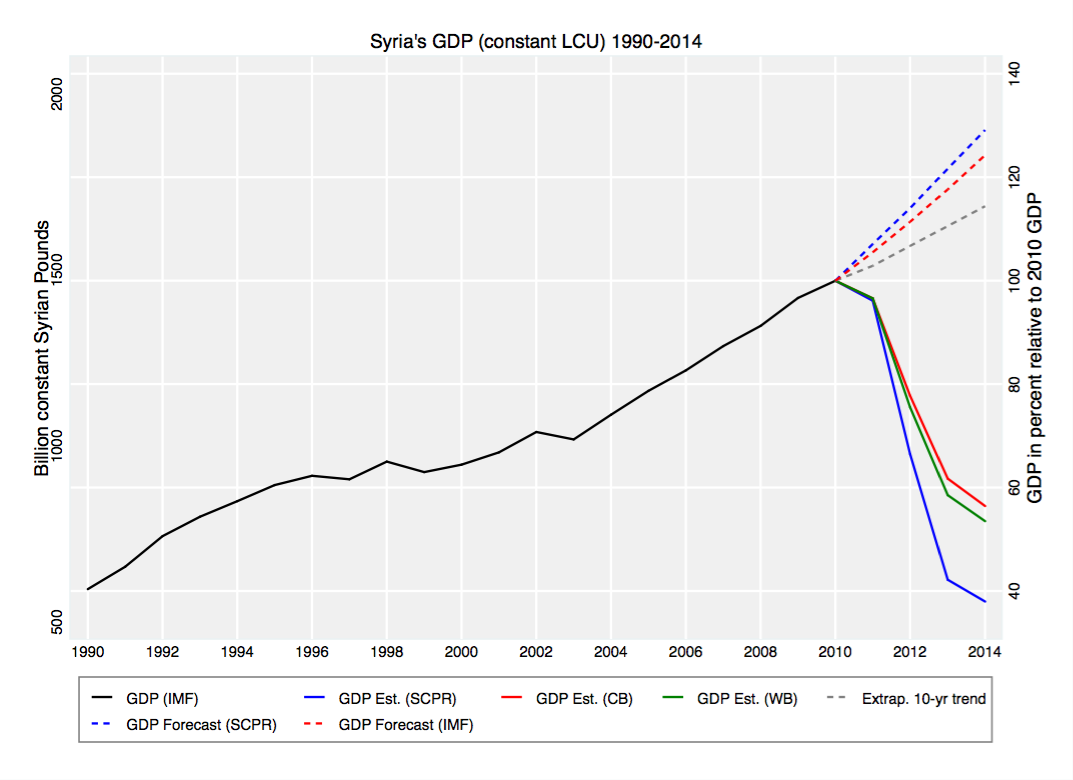
- The blue solid line shows the SCPR estimate of GDP as the most pessimistic, with the 2014 value being 62 percent lower than the 2010 value, and 70 percent lower than the SCPR’s estimated counterfactual GDP in 2014 (without the crisis).
- The Conference Board (solid red line) and World Bank (solid green) GDP series as well as the IMF’s forecasted GDP tend to be less extreme. The contraction in GDP according to the Conference Board is instead around 45 percent relative to 2010 GDP, and 58 percent lower than the IMF-forecasted GDP for 2014. The World Bank’s estimate is slightly lower.
- Both the SCPR and the IMF forecast assume Syria would have been growing faster than the past decade, and if we instead use the extrapolated trend (combined with the most optimistic actual GDP value from the Conference Board), the GDP loss in 2014 would have been 53 percent lower than the extrapolated value for the same year.
- In terms of the loss in cumulative GDP (the area in between the actual and forecasted series in the above graph), the estimated losses vary between 33-50 percent over the period 2011-2014.
Without passing judgment on the relative accuracy of any of the SCPR, World Bank, or Conference Board series of GDP, it’s clear that regardless of which series one uses, the losses are very large. The above graph actually gives yet another, more subtle, indication of how large: the most pessimistic estimate of Syria’s GDP in 2014 (from SCPR) is roughly equal that of the Syria’s GDP back in 1990 – i.e. 25 years ago. And so to put the economic cost of Syria’s conflict in a more historical context, the conflict has brought the country’s economic output back by a whole generation.
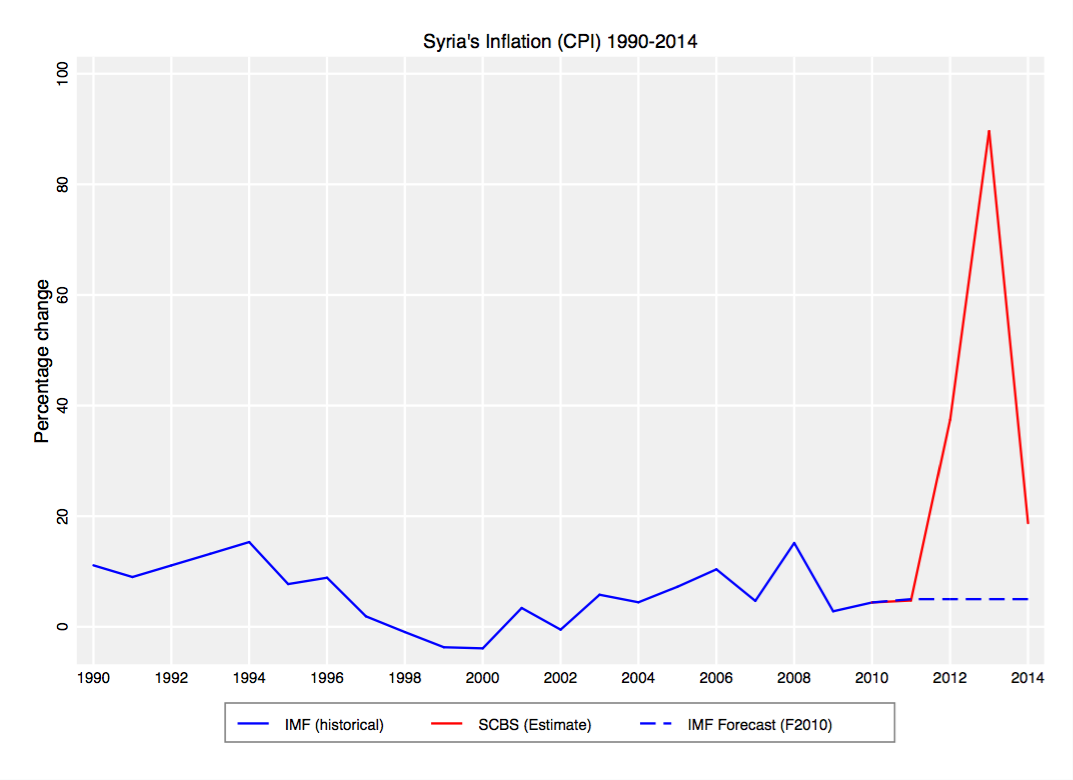
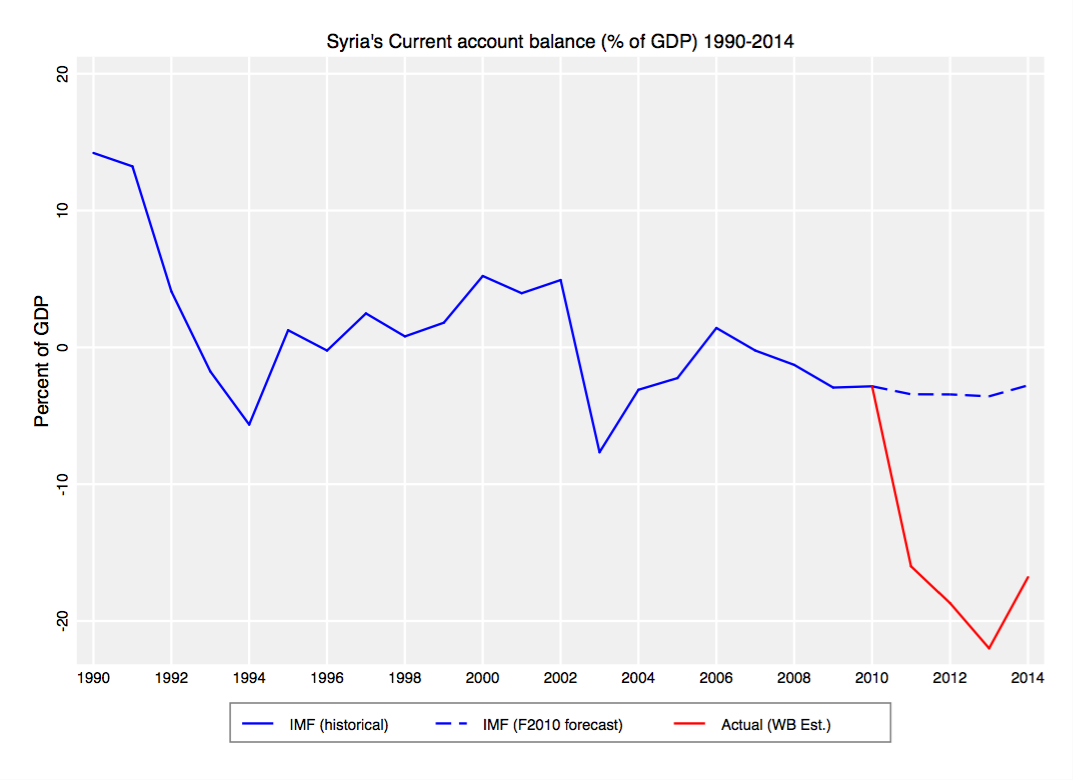
The IMF also produces forecasts for inflation and the current account balance as a percentage of GDP, and for the former CPI data is available post-2010 at the Syrian Central Bureau of Statistics (SCBS, although official statistics may underestimate the actual inflation), whereas for the latter data is available in the World Bank’s GEP reports. The two graphs below illustrate the economic crises also for these outcomes: the hyperinflation and the severe current account deficit.
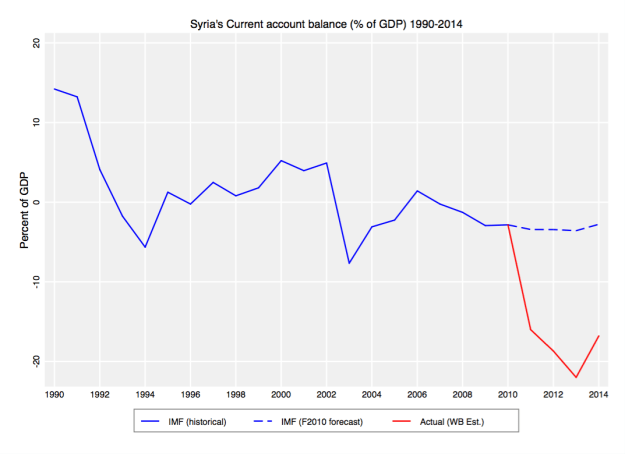
In particular the spiraling current account deficit is likely due not just to the war itself but also the sanctions put in place by Western countries “ranging from a ban on imports of Syrian oil to prohibitions on financial transfers via credit cards and banks” and as a result “[i]mports of oil products were now costing Syria half a billion dollars a month” (via FT).
A related question is to what extent Syria’s fall in GDP compares to conflict-related GDP contractions in other countries historically. For this purpose, I combine the Penn World Tables (PWT 7.1) and the UCDP/PRIO Armed conflict database. The first is one of the very few major GDP databases that includes war-torn country-years like those in Somalia, Liberia, Afghanistan etc (neither IMF nor the World Bank databases have data for these countries for long periods, and the newest PWT 8.0 still lacks many of the more – for this blog post – interesting countries), and comes with purchasing power parity (PPP) GDP data allowing comparisons across countries more easily. The use of the second database is both due to its ubiquity in research as well as ease of access. I focus on country-years with conflict onsets (starts) and calculate their corresponding four-year GDP growth rates between t-1 and t+3, plotting these in two graphs below. The left-hand graph shows the absolute GDP growth rates, whereas the right-hand graph shows the GDP growth rates minus the average growth rate in the world that year. The latter is to abstract from global time-varying factors that determine both conflicts and growth rates. Syria’s conflict onset in 2011 is shown in red. As comparison I use the more modest fall in Syrian GDP between 2011 and 2014 (from comparing the Conference Board estimates and IMF forecasts) of -45 percent.
(An aside for economists: below I am comparing Syria’s growth rate in constant local currency units (LCU) GDP with growth rates of other countries in constant PPP GDP. This would be problematic if the Syrian PPP changed substantially during period between 2011-2014. However, as the most recent ICP publication of PPP series was already in 2011 and there will not be another one for some time, and the standard way to construct PPPs is then to extrapolate future values using past values multiplied by the change in inflation of the host country divided by the change in the numeraire country’s (read: US) change in inflation (See for example Deaton’s PPP paper on this). For GDP growth in real LCU, what is lacking is the adjustment for the change in numeraire/US inflation, but as inflation has been so low in the US, any downward adjustment to a PPP GDP growth rate for Syria would be a mere few percentage points with little bearing on the below ranking of cases.)
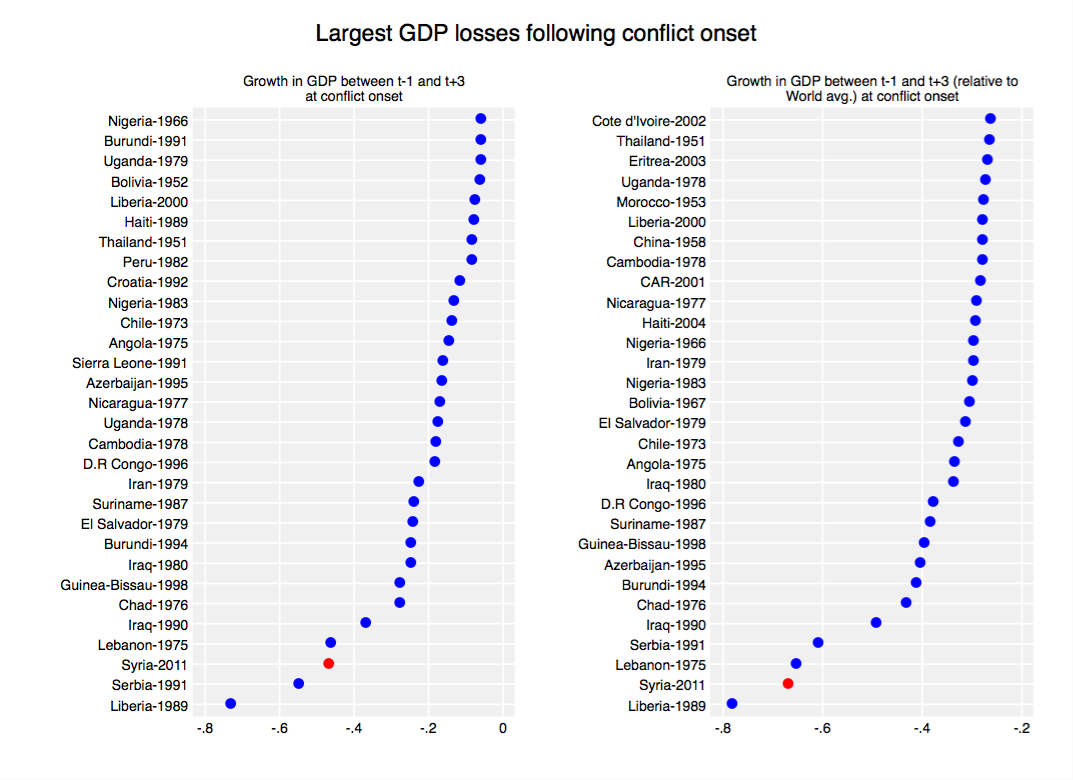
As both graphs illustrate, the economic consequences of the Syrian Civil War is an extreme case in post-1950 history. Among the worst cases are the First Liberian Civil War of 1989, the collapse of Serbia’s economy in the years following the fall of Yugoslavia, as well as the Lebanese Civil War starting in 1975. Syria’s neighbor Iraq appears twice, represented by the Iran-Iraq war as well as the Gulf War. (What constitutes as “conflict” is rather broad as it includes both Chilean 1973 coup as well as the Iranian Revolution of 1979, which masks the start of the Iran-Iraq war the year after). To the left, there seems to be some overrepresentation of conflicts in the late 1970s, likely because these conflicts occurred during severe global economic crises. Demeaning the growth rates by the world mean for the respective years (the right-hand graph) instead informs on whether the conflict was particularly economically damaging compared to the prevailing growth rates in that time period. In both graphs, Syria’s negative growth associated with the conflict stands out as an extreme outlier.
To conclude, the human suffering in conflicts like Syria’s sometimes gets lost in numbers. Yet the number themselves, here in their economic form, can also illustrate the massively destructive nature of war. Syria’s Civil War, as far as the so-far available data can tell, appears to be among the very worst economic contractions in post-war history.
