There are several interesting phenomena evident in the last Turkish elections. Whereas my previous post dealt with a couple of these, in this one I want to focus more on a specific region of Turkey, namely the Southeastern provinces, sometimes also referred to as the Kurdish provinces. (There’s a discussion to be had about what distinguishes Kurdish- from non-Kurdish provinces, but for the below analysis, I will semi-arbitrarily include Diyarbakir, Sanliurfa, Bitlis, Bingol, Mardin, Mus, Agri, Igdir, Batman, Sirnak, Siirt, Van, and Tunceli in the group of Kurdish provinces).
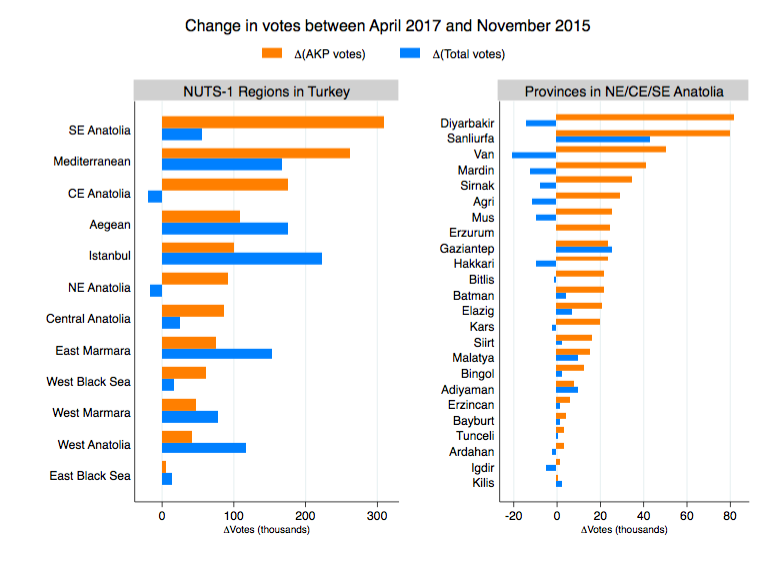
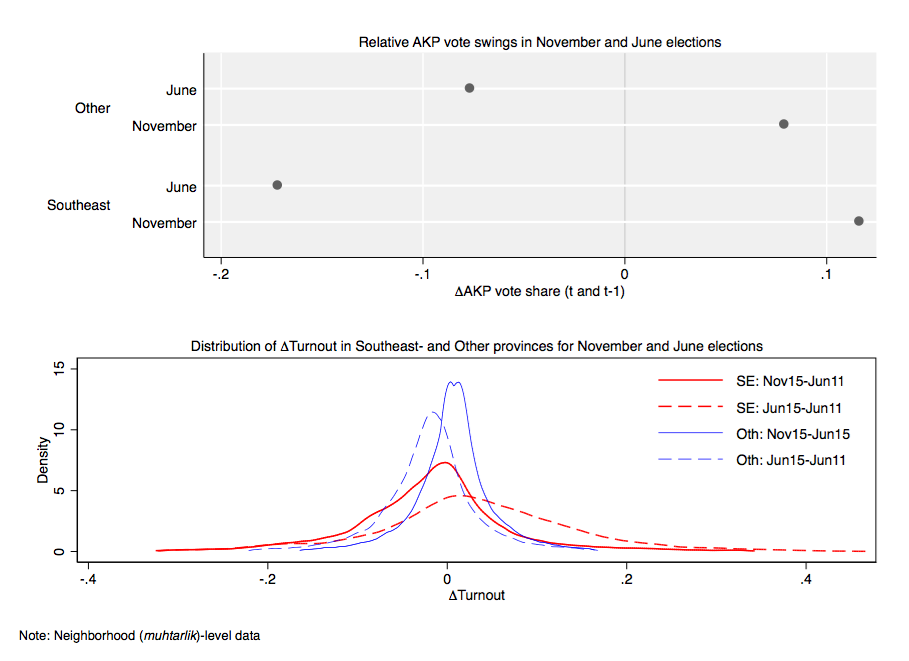
As I wrote back in June, this region saw a significant voter swing from the AKP to HDP, going a long way to helping the latter over the ten percent threshold required for participation in the Turkish parliament. In the most recent election, some of these voters appear to have switched back. The upper panel of the below graph shows differences in the AKP vote share between both November 2015 and June 2015, as well as June 2015 and June 2011, for the Kurdish and Other provinces. In June 2015, the vote shift away from AKP for the region was almost twice as large in relative terms as that in the rest of Turkey, whereas in November 2015, the relative swing in favor of AKP was larger than for the rest of the country.
Another distinguishing factor of vote patterns in the Kurdish provinces is not only that the Kurdish provinces exhibit larger changes in turnout from election to election (see the bottom panel of the below figure) but also that whereas in the most recent election the rest of Turkey experienced an increase in turnout compared to June, the Kurdish provinces experienced a decrease. Still, even though the average change in turnout was negative, there is still plenty of variation (which can be seen from the red curves, compared to the blue curves, being “shorter and fatter”), and a significant number of the neighborhoods in the latter provinces experienced significant positive increase in turnout.

Undoubtedly, one possible explanation for the decrease in turnout and the increase in AKP vote share could be the ongoing conflict between the Turkish state and the PKK. The decrease in turnout could be due to safety concerns in conflict-affected areas, which might be more likely to affect pro-HDP neighborhoods, and might also be correlated with a shift to the AKP as a means to achieve stability for some.
In this case, we would expect an overall negative relationship between the change in turnout and the change in AKP vote shares between the November and June elections. As I showed back in June, the large increases then observed in HDP vote shares in provinces like Agri, Igdir, Mus, Batman, Diyarbakir etc, were also accompanied by substantial increases in turnout.
This relationship, however, changed in the November elections, as can be seen in the below graph which plots (local averages of equally-sized bins for) differences in party vote shares against differences in turnout between November and June.
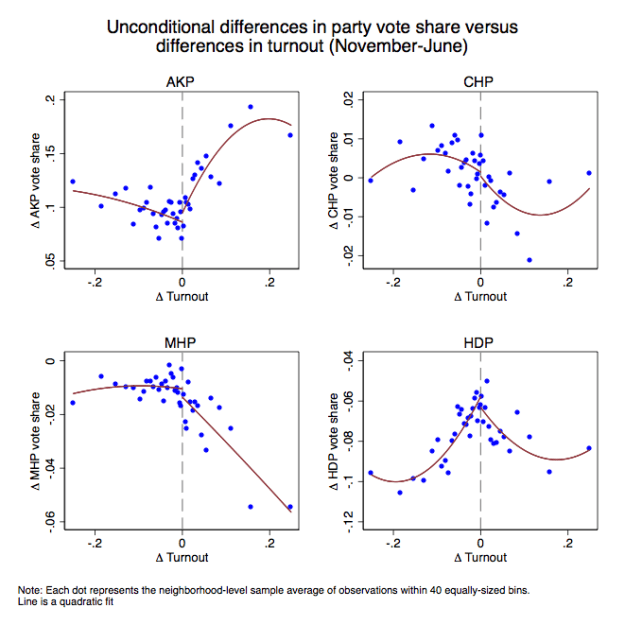
The main thing to note is the apparent “kink” in the relationship for the AKP and HDP (and to a certain extent in the MHP) graphs. In both of these graphs, the slope of the line appears to change sharply at the zero turnout change point. For AKP, the party appears to benefit not only the larger the fall in turnout is, but it also larger the increase in turnout is. (The HDP graph has the almost exact inverse relationship, which is unsurprising since in the Kurdish provinces votes tend to go either to AKP or HDP and so a positive change in the former implies a negative change in the latter.)
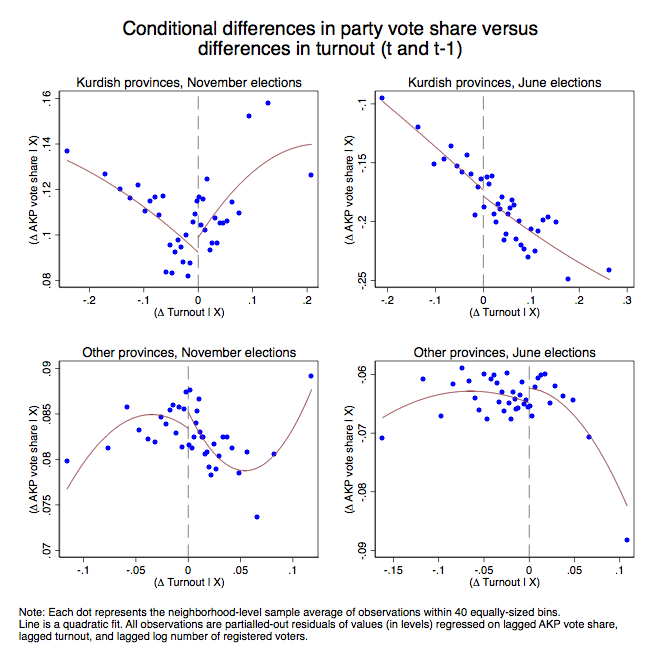
Before I go any further with this, an important question to ask is why this might matter. It matters because this kink is not to be seen in the previous election, nor is to be seen for the rest of Turkey in either the current or past election. In order to demonstrate this, I below compare differences in AKP vote shares and differences in turnout for Kurdish versus the Rest of Turkey, for the November and the June election respectively. Also, to make the analysis somewhat more robust I use the residuals from regressing the difference in party vote shares on lagged levels of turnout, AKP vote share, and the log number of registered voters in a neighborhood. As before, each dot represents the local average of equally-sized bins.

Here, it is clear how the slope changes only for the Kurdish provinces, and how it is the neighborhoods with positive turnout change that exhibit a peculiar slope; in November they exhibit a positive relationship with the change in AKP vote shares, whereas in June it was negative.
One possibility could be that this reversal of the slope does not represent a kink but rather some non-linearity that may have come about for a number of reasons that are unknown, yet completely innocuous. Moreover, the non-Kurdish provinces suggest that a non-linear relationship per se is not necessarily something strange. So how do we know this is actually a real “abnormal” kink and not just some “normal” non-linearity.
Fortunately, we can test for the presence of a kink at zero turnout change using Regression Discontinuity methods, which have relatively recently been extended to allow for discontinuous changes in the first derivative of the outcome (rather than the level of it). This can also easily be implemented with local linear RD models with optimal bandwidths using the methods and tools developed by Calonico, Cattaneo, and Titiunik (hereby CCT, see here, and here).
Using RD shifts the focus entirely on the cutoff, which in this case is the zero turnout change, and allows us to answer the question of whether an infinitesimal change in the “running variable” (here the change in turnout) results in a discontinuous change in the first derivative of the outcome variable.
(Note that whereas RD designs are usually employed to infer causal effects, here I’m merely interested in whether the first-derivative changes in a statistically significant way.)
Below, I show a simple RD kink plot with data in bins and a quartic polynomial fit on each side of the zero turnout change cutoff.
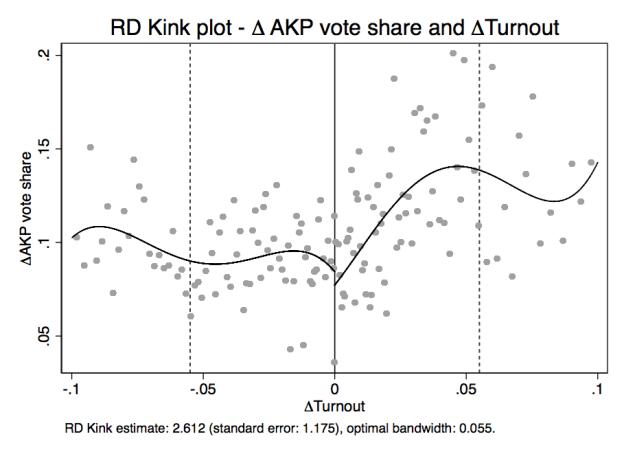
The slope appears to change discontinuously at the threshold, and formal testing using CCT’s rdrobust command in Stata results in a statistically significant estimate of 2.6 (the left-hand slope is -0.26 and the right-hand slope is 2.35). On the right-hand side of the cutoff, this represents a large effect, as a one percentage point increase in the difference in turnout corresponds roughly to a 2.4 percentage point increase in the difference in AKP vote share.
Sure, this may seem odd, but why would this necessarily imply anything irregular? And is there a way to link this analysis with that in my previous post?
The previous post focused on the last digit distributions of party counts, and one of the main findings in that last digit distributions changed character in the Kurdish provinces between the November and June elections. One interpretation (although there may be other ones too) of this is not just that these last digits are from different distributions, but also that this implies manipulation.
So a logical follow-up related to the above analysis is whether we can observe a discontinuous jump in the distribution of the last digit at around zero turnout change. Similar to the outcome in the past post, I use the mean of the last digit, with the difference here being that the outcome variable is the neighborhood-level average of the party vote count’s last digit across all ballot boxes within that neighborhood. And as this mean should arguably be flat, I look for the existence of jumps in the level as opposed to the first derivative as above.
Below, I illustrate the RD design for discontinuous jumps in the last digit for AKP and the HDP’s vote counts for November and June respectively. Under each graph, I also show the RD estimate and its associated standard error and optimal bandwidth used in the estimation (again using the rdrobust command).
In this case, and as opposed to that in the previous post, the test is not whether the last digit distribution changes across time but whether it changes at zero turnout change in each of the November and June elections respectively. The stipulated assumption here is therefore that, absent manipulation, we should not observe any discontinuous jumps at the cutoff around zero turnout change.

As can be seen form the above figures, the AKP last digit exhibits a statistically significant jump around the cutoff in the November election, with an estimate of around -0.7. which corresponds to roughly an 18 percent change relative to the mean just to the left of the cutoff. Again, this is a rather significant effect even in terms of magnitude.
In the June elections, the AKP last digit also exhibits a negative RD estimate although it’s somewhat smaller in magnitude. As for the HDP, there is no statistically significant jump at the cutoff and estimates tend to be much closer to zero. Consequently, to the extent that a discontinuous jump here implies manipulation of votes, it’s only occurring for the AKP’s votes.
One mechanism which could drive the above result that comes to mind is if the AKP, for a subset of neighborhoods, was able to “add” AKP voters in such significant numbers so as that all of the neighborhoods in which this occurred resulted in positive turnout relative to the June election. If, in turn, these were manipulated votes and their numbers decided by an individual as opposed to a random process, this could explain the jump in the last digit distribution at the cutoff.
Nonetheless, as with the previous statistical analysis of Turkish election I’ve done on this blog, the by now usual disclaimer applies: these statistical relationships could be considered consistent with some form of voter manipulation, but they are by themselves not necessarily proof of it. And just because I have not been able to imagine any more innocuous explanations for these kinks and jumps doesn’t mean they don’t exist.


