A curious aspect of the new GDP series (which I’ve covered here, here, and here) coming out of Turkey is the divergence between GDP growth and the stock market. Whereas official GDP statistics shows higher growth during the 2010-2015 period than the preceding six years 2004-2009, the opposite is true for the Turkish stock market.
This can be seen from the data series published by Turkstat called “The Rates of Financial Investment Real Profits’, which tracks the real returns of not just an investment in the flagship BIST100 equity index of the Borsa Istanbul, but also investments in US dollars, the Euro, Gold, Government debt, as well as bank deposits.
The below graph shows real (inflation-adjusted) return indices for all of these asset classes between January 2004 to January 2017, with the base month set to January 2010.

Whereas in the per-2010 period, equities was the asset class that yielded the highest return (the blue line has the lowest starting point among the series and thus the highest increase up until the base month in January 2010), in the post-2010 period it had the lowest return (the blue line has the lowest end point of all the series).
As shown in the below graph which plots period-specific cumulative returns, this means that if a Turkish investor had invested in the BIST 100 stock index at the starting period, and sold any shares in January 2010, the investor would have made a 153% real return. In contrast, if the same investor had bought shares of the same index in January 2010 and sold in January 2017 the return would have been -8.1%.
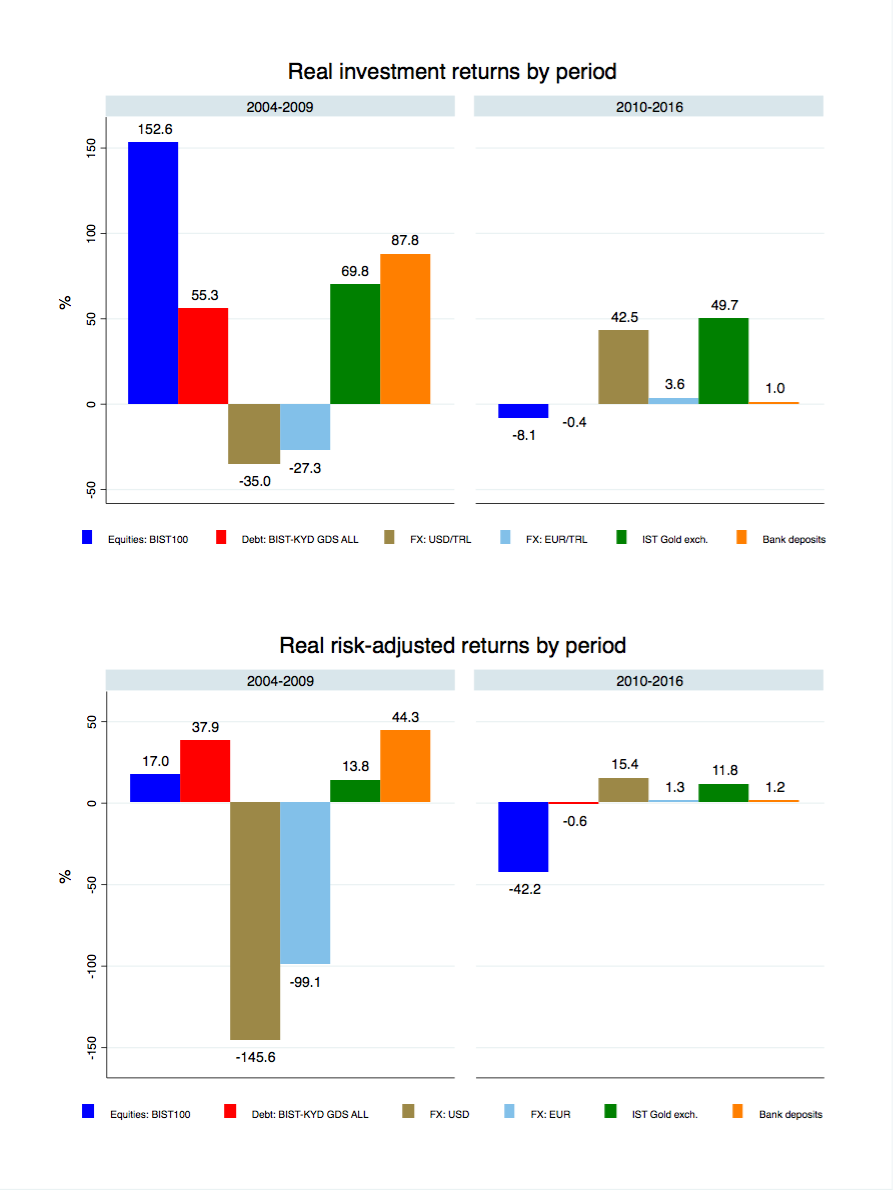
If we adjust for risk using the (refined) Sharpe ratio, stocks are no longer the asset class with the best risk-return tradeoff pre-2010, but it nonetheless remains the worst in the post-2010 period. (Note: In the above graph, the numerator is the asset return, not the excess return. The point is to rank the different asset class returns, and as taking excess returns would simply mean subtracting the same risk-free return from each asset, it does not affect the ranking).
Thus, according to Turkstat’s own data on financial investment returns, Turkish investors would have experienced both higher returns and a better risk-return tradeoff investing their money in US dollars and gold rather than Turkish stocks, debt, or bank deposits. So when Turkish government proclaims the need to shift investments into Turkish lira assets from foreign assets, they appear to be asking ordinary household investors and firms to lower their expected returns and increase their exposure to risk (at least if the recent past is any indication of future performance).
This is certainly interesting, but lower stock market returns and GDP growth rates moving it opposite directions do happen on occasion. In fact, research has shown that the link between GDP growth and equity returns can be ambiguous. This is perhaps not so surprising as equity prices, a forward-looking variable, are to a large extent evaluated in how ex-ante returns perform in a wider portfolio and thus covariances with corresponding assets in other countries will also matter, which is not the case for GDP growth, a backward looking variable. And so, perhaps the declining equity prices in the post-2010 period mask solid growth in fundamentals, i.e. earnings?
Via the website of Borsa Istanbul, these earnings can be backed out from its publication of price-to-earnings (P/E) ratios for the entire stock market index (the file called “ENG_EM_MarketValue.zip”). In order to decompose the changes in the stock index price into growth in earnings versus growth in the value of those earnings, I define the log of the price of the stock market index as the sum of the log aggregate earnings and log P/E ratio, and then difference this expression with regards to time. Changes in the log returns to the stock market index can thus come from either changes in the log earnings (fundamentals) or changes in the log P/E ratio (how each unit of earnings is valued, i.e. valuation effects) .
The graph below shows average annualized real log returns for the two periods 2004-2009 and 2010-2015 respectively.

In the pre-2010 period, the high annual log return was driven by both earnings as well as how the market valued these earnings, but predominantly by the former. In the latter period, the positive earnings growth was almost entirely counterweighted by negative changes in how these earnings were valued. Thus, the lower stock market return in the recent years can be explained by both negative valuation effects as well as a worsening earnings fundamentals – whereas between 2004-2009 annual earnings growth was 8.3 percent, in 2004-2010 it was a much smaller at 3.3 percent. Consequently, even abstracting away from any valuation effects that could be driving Turkish equity returns downward, the evidence suggests that underlying real fundamentals have deteriorated substantially after 2010.
Still, lower aggregate earnings growth in the Turkish stock market might have limited influence over the Turkish economy because the country’s comparably low stock market to GDP ratio, meaning the aggregate stock market offers but a limited view of the country’s economic growth, and perhaps especially so if it is construction-driven.
There is nonetheless one sector of the Turkish stock market that ought to have been affected by the construction-driven growth: the cement manufacturers. Arguably, it is hard to imagine the immense urban regeneration and infrastructure projects of the Turkish government to not have had consequences for Turkey’s relatively substantial and competitive cement market. Surely, a construction boom supposedly propelling Turkey to China-style growth rates would have boosted demand for one of its most important inputs. Moreover, in the last couple of years, several stock analysts have published glowing reports of Turkey’s major cement companies amidst the construction boom (see for example here and here).
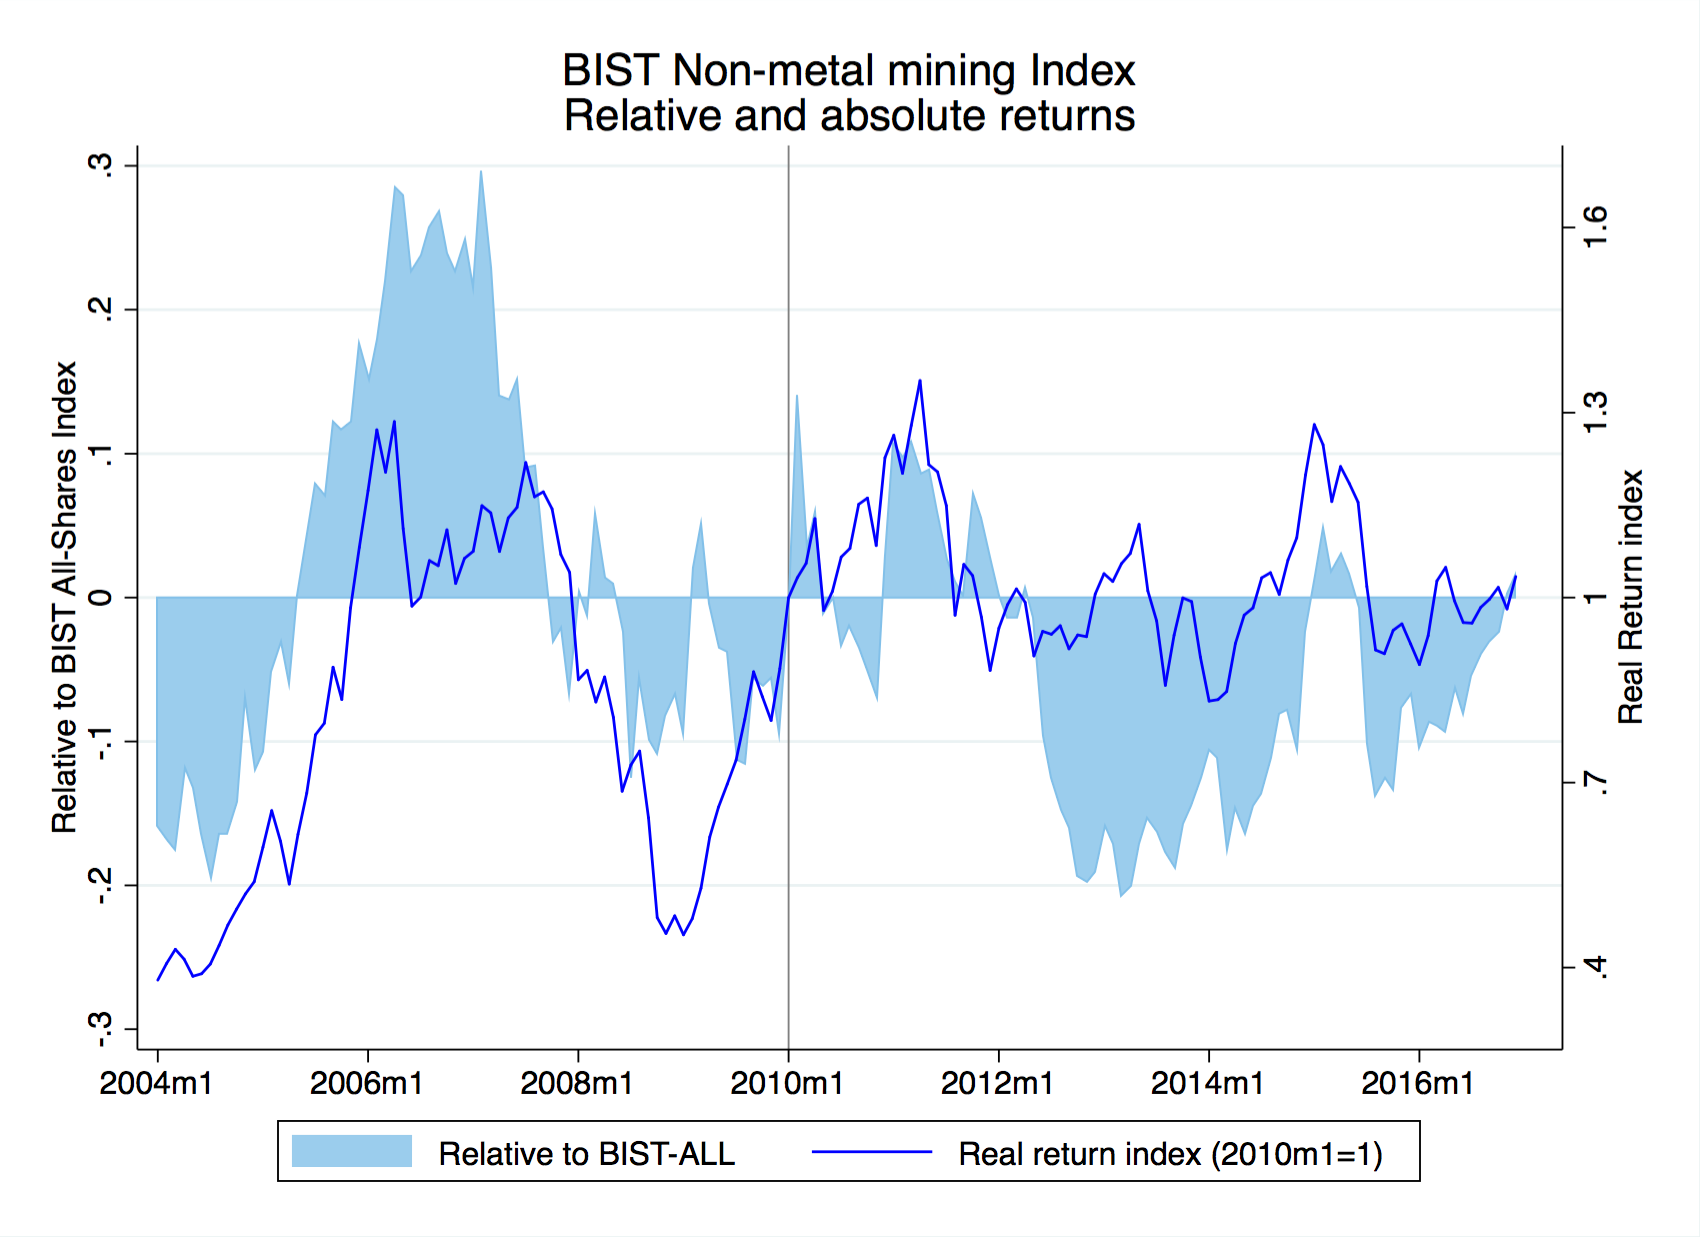
One of the subindices on the Borsa Istanbul is the Non-metal mining products index (XTAST:IST), which is composed to three fourths of cement companies (the remainder constituting mostly glass-producing firms).
The below graph shows both the absolute real return of the XTAST over time as well as its performance relative to the all-shares index (XUTUM:IST)

Not only has the stock index performance for cement companies overall been rather disappointing, showing effectively a zero real return in the post-2010 period; but equally noteworthy, the cement-dominated subsector appears to have also underperformed that of the overall stock market index.
In conclusion, there are several intriguing components of Turkey’s new GDP series. One of them, demonstrated in this post, is that a constriction-driven post-2010 GDP growth rate, on paper fitting for an Asian tiger, has not had commensurate consequences in the stock market, nor has it boosted the market values of cement producers who would be natural benefactors of such a phenomenon.
