There are a number of striking features of Sunday’s referendum in Turkey, which resulted in a narrow victory (51.4% being the official “YES” vote share at the time of writing this blog post) for the constitutional amendment proposed by the government.
There are, however, numerous challenges to the result, both with regards to the environment in which it was carried out as well as more direct accusations of election-day irregularities. Going through the election data is probably going to keep many people busy for the next couple of days weeks months. For now, I wanted to highlight one particular phenomenon which struck me as interesting.
At a first glance, when plotting the vote share distribution of the YES vote at the ballot box level was that the “Never-AKPers” were gone. These Never-AKPers are voting groups that have extremely few or literally zero votes for the AKP. In past elections, they have been quite noteworthy. The below illustrates this by plotting the distribution of the AKP vote shares for the 2011, June 2015, and November 2015 parliamentary elections and in the bottommost graph the YES vote share in Sunday’s referendum.
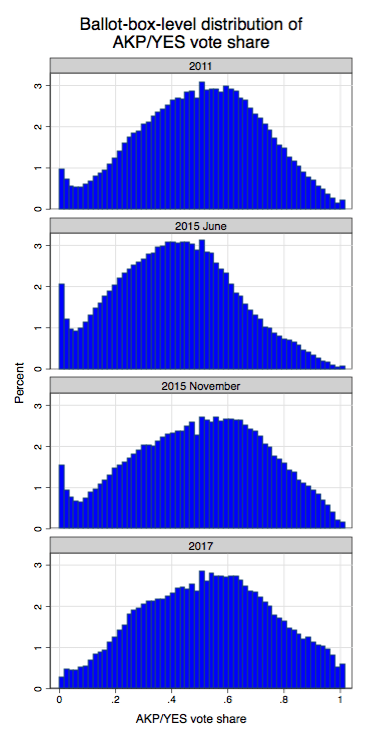
Essentially, the fat left tail (i.e. the ballot boxes with next to zero AKP votes), which stands out in the previous three elections is almost entirely gone in 2017. What happened? Did the areas where the AKP was the least popular suddenly have a change of heart?
These Never-AKPers tend to be, with some exceptions of course, voters in the predominantly Kurdish southeastern region of Turkey. And so, in these areas, there ought to have been a vote swing from those previously voting for the Kurdish party HDP in past elections to a YES vote for the AKP government’s proposed constitution (which the HDP has stringently opposed) in the current election. Interestingly, the AKP may have gained as much as 450,000 (preliminary and subject to possible change) votes in the Southeast compared to November 2015, corresponding to roughly 10% of votes of the entire region. Especially since turnout was significantly lower this time around, by my estimates by some 150,000 (preliminary and subject to possible change).
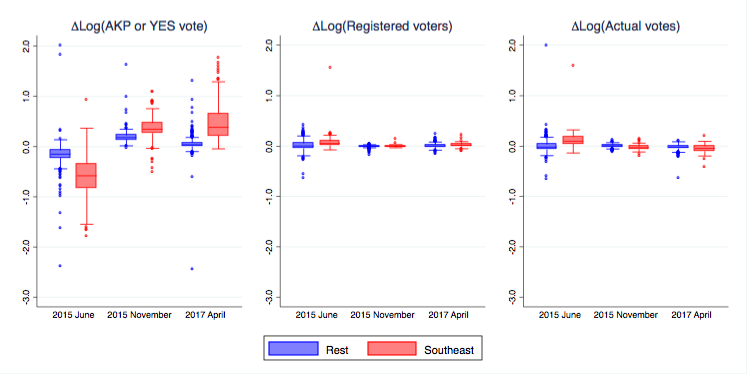
The degree to which there has been a vote swing in the southeastern areas to the AKP can be seen in the below boxplot graph, which plots the distribution of the district-level (ilce) log difference between the number of votes received by AKP (or the YES side) in any of the June 2015 November 2015, or 2017 elections and the number of AKP votes in the previous election.

The graph shows AKP losing votes in the June 2015 election, especially in the Southeastern region, to then experience a sharper-than-the rest swing back in November that same year. In the last 2017 referendum election, this region is again pushing further toward the AKP(‘s constitution), even as the rest of Turkey experiences somewhat of a reversion to the mean. For the vote swing in the Southeast in 2017, the distribution is also clearly skewed towards positive an AKP-swing, partly driven by a number of outliers.
Two things are odd with this: the first is that the Southeast region experiences a roughly equally large (if you care about the median) or a larger (if you care about the mean) pro-AKP vote swing than in November 2015, just as the rest of Turkey experiences the opposite. The second is that the distribution of the AKP vote swing is so much more skewed toward the AKP than any group in any of the previous elections. (In fact, there are only observations in the “outer fence” on top, which makes it stand out among the other distributions.)
There are no commensurate swings in either registered voters or votes cast, as shown in the middle- and right-hand graphs.
This doesn’t have to be anything peculiar or strange if the pro-AKP swing in the Southeast is coming from “latently” pro-AKP areas (areas that were already pro-AKP in the region. Nor does the above graph by itself offer any link to the first graph I showed of the disappeared Never-AKPers.)
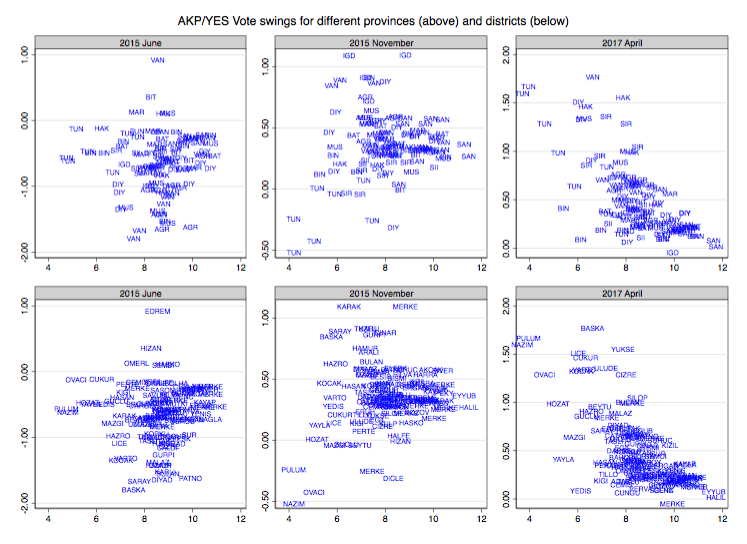
However, it turns out this is not the case. In fact, the largest pro-AKP swings appear to come from the least pro-AKP areas in the region. This can be seen in the below graph, which plots, again, the log pro-AKP vote swing against the log number of AKP votes in the past election for both the Southeastern districts (red) and the rest of Turkey (blue).

Note two things about the left-hand and middle graphs: the largest swings away and back to the AKP occurs mostly among the mid-range of AKP voters in the southeast (in red), not the very least AKP-supporting districts. The districts that were already not at all voting for the AKP in the previous elections tend to remain this way. That is, until last Sunday. Here, almost the entire lower end of the distribution is experiencing some of the largest pro-AKP vote swings in the entire distribution. This was unexpected.
But it gets even more surprising when one investigates which provinces and districts are undergoing this political change of hearts. In November 2015, it was predominantly the provinces of Agri, Igdir, Mus, Sanliurfa, Van, and even a few districts of Diyarbakir that swung the most toward the AKP. In 2017, however, the biggest pro-AKP changes occurred in Tunceli, Hakkari, Sirnak, and Diyarbakir. The three former provinces here are among the worst affected by the war between the PKK and the Turkish state.
It gets still a bit stranger once we look at which districts these are. The Diyarbakir district at the 1.5 point in the right-hand graphs is none other than Lice, which is as much a Never-AKPer as you’re ever going to find. Among the other districts topping the pro-AKP swing distribution are Cizre, Yuksekova, two heavily damaged districts from the military conflict, and Uludere, the scene of the infamous Roboski strike.
The voters in the strongholds of the HDP, where sympathies for the PKK and antipathy toward the Turkish state is among the highest in the country, have truly chosen a peculiar time to switch to the AKP. What could possibly explain how such strongholds of the pro-Kurdish movement would have waited until 2017 to start voting for the AKP?
Security?
One possibility could be that the composition of voters has significantly changed in some Kurdish areas since November 2015. For example, if there’s been an increased inflow of security personnel who register to vote in these areas, that could be one explanation.
At an aggregate level, there doesn’t seem to have been any larger positive changes in either votes cast, as can be seen below, but there does seem to have been an uptick in registered voters in 2017 compared to the previous election.

Most of the Kurdish areas saw decreases in votes cast, and no or small increases in registered voters. This is, in a way, also somewhat interesting. Thus, either any inflow of security personnel was too small to really effect the voting population, or the inflow of security personnel would have to have been evenly matched with the outflow of local residents fleeing the conflict. This would then beg the question of how this group of displaced citizens were given the change to vote elsewhere.
Is the Never-AKPer phenomenon by itself a sign of an irregularity?
Above, I make make no judgement as to whether the initial existence of the Never-AKPers is by itself a problem for the elections or not. Perhaps these are simply an outcome of very homogenous political preferences in some areas. Or perhaps not, in which case there’s a Devil’s Advocate kind of argument to be made:
(I am also grateful to a number of midnight-oil-burning DMs from Alex)
Alternatively, could a switch in allegiance of the local elites, effectively tribe leaders, explain the phenomenon? As I wrote just after the June 2015 elections, the HDP’s success was to a large extent brought about by it successfully gaining the support of non-core voters among more religiously conservative Kurds. At the time, there was some reporting on HDP’s specific campaigns to win over large tribal communities in Kurdish Turkey (see here, here, and here). This could have resulted in a vote swing of so-called “block votes” , whereby “persuading only the tribal chief, community leaders secure the backing of thousands of people.” In the November 2015 elections, there was a significant reversal in this non-core group of Kurds, most likely as the government managed to regain their support.
But before getting into more details on this, let’s take another look at the data. In this case, I’ve split the data into two groups, one including ballot boxes belonging to provinces in Turkey’s Southeastern region, and the second one including all others. The below graph is the same as the first one above, but split along these two subgroups

Although there appears to be some Never-AKPers even outside of the Southeastern provinces, I will focus mostly on the Southeast where they tend to be much more common. The left-hand side panel shows that 10-15 percent of all ballot boxes had little or no AKP votes in the June and November elections, with a smaller share in 2011 and, as previously documented, very few such cases in 2017.
Which provinces are driving this result can be gleaned from the below graph which plots the same kind of plot but for each province (in the Southeast).

In several cases (Agri, Mus, Siirt, Sirnak, Van etc) the high densities at the very lowest part of the distribution seem to occur almost exclusively in the two 2015 elections. In the June 2015 elections, for example, Hakkari saw roughly half its ballot boxes having little or no AKP votes, and the corresponding percentages for Agri was 25%, 15% in Diyarbakir, 20% in Mardin, 40% in Mus and Sirnak, 60% in Tunceli, and 20% in Van.
If this phenomenon was due to pro-HDP irregularities, occurring under an absence of state control, one would expect these to disappear in the November 2015 election, as the state security forces reasserted control over the region. Although this seems to have occurred in some provinces like Agri, Bingol, and even to some extent Siirt, in most others it continued. Similarly, if the very high densities of low-AKP-voting areas were a result of of block voting via traditional tribes, then shouldn’t the high densities at the lower end of the distribution have disappeared entirely in November?
In 2017, however, the Never-AKP phenomenon is entirely gone. Curiously, both in Bingol, Sanliurfa, and even to a degree in Bitlis and Siirt, we now observe the opposite, high densities at the very top of the distribution. And so, under the assumption that Never-AKP ballot boxes were an outcome of some form of anti-AKP irregularities under state absence, this would then imply that the reassertion of state control lead to Always-AKPers, which ought to then constitute pro-AKP irregularities. But the incongruence between the timing of state reassertion of control and the Never-AKPers lingering on even afterwards suggest tribal block voting and irregularities with a pro-HDP bias are unlikely to be the main driver of why the Never-AKPers disappeared.
Overall, however, I suspect there are multiple factors at work. It would be naive to claim that there couldn’t have existed any irregularities benefiting the HDP in previous elections, nor that local elites and block votes don’t matter at all. And if the AKP has been able to stop or harness such practices, it would then be one more institutional feature of Turkey that it has successfully been able to turn to its advantage. (In particular, the distribution for Sanliurfa in 2017 looks rather concerning.) The Southeast remains its poorest region, and if there was any area in Turkey where electoral fraud would be most likely to go unnoticed, it would most likely be here.
Meanwhile, I don’t think one should underestimate factors I have not discussed very much here, such as the internally displacement of large numbers of the population or the possibility that local residents might simply vote for the constitution in the hope that the political instability would end. There is also the issue of why there are Never-AKPers outside of the Southeast. These factors, however, would require a post of their own.
