The Turkish Statistical Institute recently released a revision to its GDP series (here and here), with some noteworthy consequences. Not only did the new series produce an upward revision of the level of GDP by around 20 percent (for GDP in 2015), but equally striking is the upward revision in the real growth rate of GDP after 2009 by an average of 1.8 % per year. The quarterly data is plotted below for new and old GDP and GDP growth rates (year-on-year) respectively.

The new statistics revision, taken at face value, arguably boost “the president’s economic arguments”, putting Turkey’s economy in a kinder light than previously thought. The timing is auspicious, as the government will likely try to revamp the constitution during the coming year.
The changes to Turkey’s GDP and growth rates are very large ones not only from an absolute perspective, but especially so in comparison with other cases of ESA (European standards) or SNA (United Nations standards) revisions. In OECD countries, such revisions have tended to have much smaller impacts on the levels of GDP and, at least on average, close-to zero effects on GDP growth. In most of these other cases, large revisions tend to be driven mostly by the changes in standards themselves, although in some of them, wider changes in how statistics are collected were more dominant.
Common factors that are likely to change the GDP statistics pertain to treatment of R&D expenditures and military weapons systems as investments, as well as inclusion of illegal economic activities. In countries with higher GDP per capita, capitalization of the former two tended to have the largest consequences, whereas in countries with lower GDP per capita, changes tended to be driven more by wider statistical improvements. For example, Cyprus’s 2010 GDP increased by 9.5 %, mostly because of such diverse statistical improvements. All other EU28 countries experienced lower impacts on GDP from ESA-2010 revisions.
So what explains the unprecedented upward revision in Turkey’s economic performance as a result of the new statistical revision? Some have noted deviations from the ESA-2010 standards on Turkey’s part, such as the use of 2009 as a benchmark rather than 2010.
In this post, I want to make three points.
- The main driver in the changes in the real growth rate appears to come from changes in the nominal GDP growth rate to a larger extent than changes in the implied GDP deflator. This points to crucial changes in how TÜİK calculates nominal GDP.
- The main reason why nominal GDP is higher is because estimates of gross fixed capital formation (GFCF), i.e. net investments, are higher.TÜİK’s new revision has added a cumulative investment amount of 1.76 trillion Turkish lira since the fourth quarter of 2002, equivalent to 10% of GDP per quarter. To put this number in perspective, if translated into US dollars in today’s exchange rate, it corresponds to ca $496 million, roughly the size of Sweden’s GDP in 2015 (according to the World Bank)
- The main reason why investments are higher is because investments in construction is higher. Roughly all the extra cumulative investments coming from the new revision are made up of those from construction investments.
(Note: For Turkish-speakers, here is a report bringing up very similar points.)
The claim in point 1 can be gleaned from the below graph, which decomposes the difference in the new and old real GDP growth rates in the following manner. First, real GDP (old and new) is characterized by nominal GDP divided by a GDP deflator (the latter can backed out of the TÜİK data). Take the natural logarithm of this expression and subtract the corresponding value for the previous year’s quarter, to get year-on-year changes in logs for nominal GDP and GDP deflators respectively. Rearrange and take the difference between the new and old series of log changes in real GDP:
![\Delta ln(RGDP_{new}) -\Delta ln(RGDP_{old}) = [ \Delta ln(NGDP_{new}) -\Delta ln(NGDP_{old})] - [\Delta ln(P_{new}) -\Delta ln(P_{old}) ]](https://s0.wp.com/latex.php?latex=%5CDelta+ln%28RGDP_%7Bnew%7D%29+-%5CDelta+ln%28RGDP_%7Bold%7D%29+%3D+%5B+%5CDelta+ln%28NGDP_%7Bnew%7D%29+-%5CDelta+ln%28NGDP_%7Bold%7D%29%5D+-+%5B%5CDelta+ln%28P_%7Bnew%7D%29+-%5CDelta+ln%28P_%7Bold%7D%29+%5D+%26nbsp%3B&bg=ffffff&fg=444444&s=0&c=20201002)
The below graph plots the left-hand side of the above equation as well as the two square-bracketed expressions on the right-hand side

This graph shows two main things. The first is that the difference in the differences in log real GDP between the new and the old series is almost entirely driven by differences in nominal GDP (the red lines tracks the gray line very closely throughout the sample whereas the blue line tends to center around zero). Secondly, there is little variation between the new and old series in terms of the price level of GDP until the third quarter of 2009, but with a few exceptions notwithstanding, the difference in real GDP growth appears to be mostly driven by nominal GDP.
The second point can be illustrated by plotting the main components of Turkey’s GDP for 2015 (in current prices) stacked on top of each other, with the old series to the left and the new to the right.
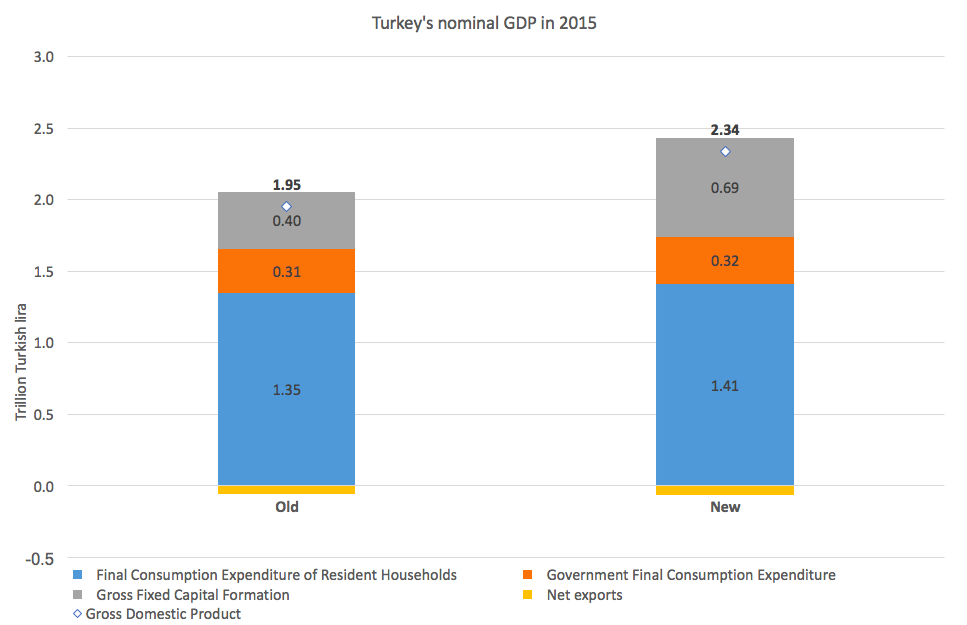
GDP in the new series (TL 1.95 trillion) is almost exactly 20 percent higher than it is in the old series (TL 2.34 trillion). With the exception of a 4 % increase in household consumption expenditure, this change is entirely due to an increase in gross fixed capital formation of roughly three-quarters (from TL 400 billion to TL 690 billion).
The changes expressed in shares of GDP can be seen below. The new series implies much higher investment shares of GDP, mostly at the expense of consumption.

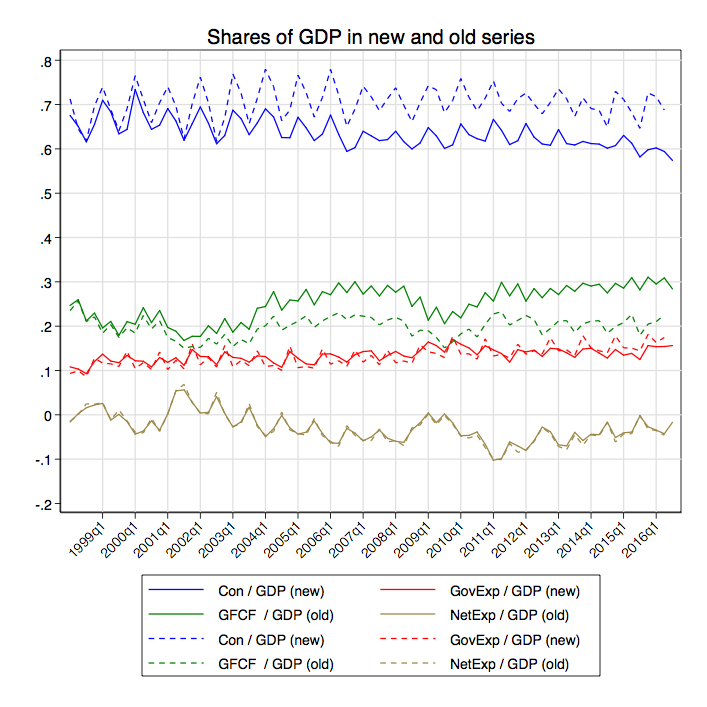
Previous series of expenditure side GDP further broke down investments by public and private construction and machinery & equipment respectively. The new series changes the categories to a construction, machinery & equipment, and other. Below I plot the shares of GDP for total of the two in the new and old series respectively.
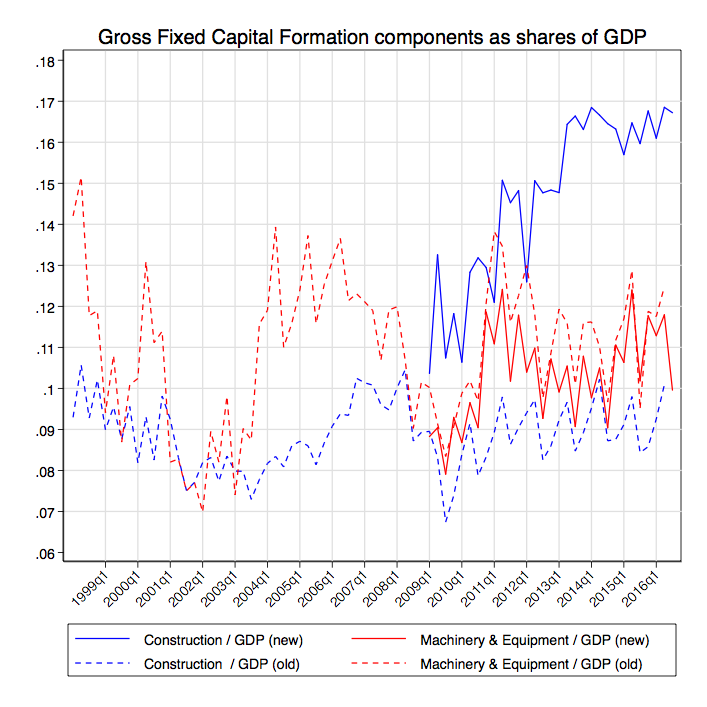
In the old series, machinery & equipment carried a higher share of GDP than construction. In the new series, which only includes subcomponent data from the first quarter of 2009, this is reversed. Moreover, from this quarter onwards, the construction investment share of GDP increases rapidly from around 11.5 % in the beginning of the subsample to 16.5% at the end of it. The gap between new and old investments is therefore almost driven by the gap in construction investments.
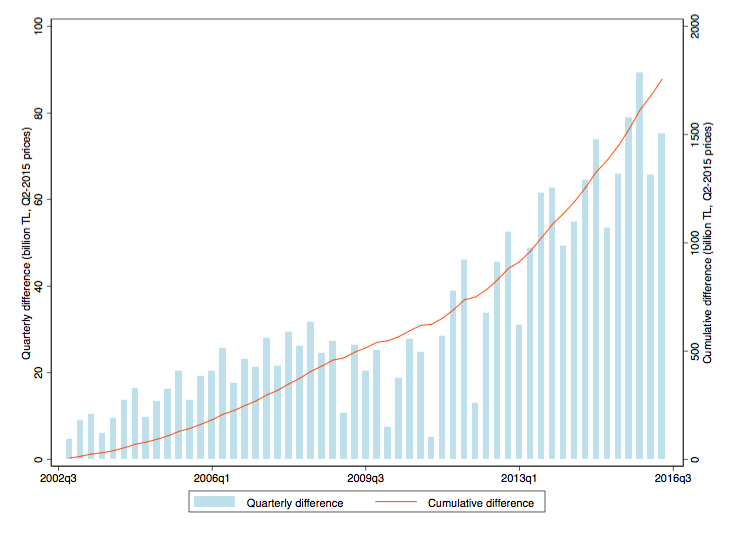
The last figure, below, plots the the quarterly differences in new vs old total investments from the last quarter of 2002 and onwards in blue bars, as well as the cumulative amount (red line). (These figures have been converted into constant Q2 2015 prices.) In the final period the cumulative amount of added investments was TL 1.76 trillion. With the current exchange rate of 3.54 TL/USD, this corresponds to roughly $496 billion. In 2015, the World Bank recorded Sweden has having roughly this amount as GDP.
The above analysis focuses predominantly on levels (or shares) of GDP. In addition we would also be interested in an exposition that put more focus on GDP growth rates and component contributions to growth. Illustrating the individual contributions to growth for the new series is a bit difficult as Turkstat has yet to publish new constant price GDP series (which forms the basis with which such contributions are calculated) to compare with the old. Therefore, for now, I have calculated the component contributions to GDP growth in current prices for the new series, and then subtracted the corresponding contributions from the old series. This abstracts away from differences in how the price indices changed (which as shown above seems to be of much smaller order than changes in how nominal GDP is counted and assembled).
The below figure illustrate how the growth contributions for both the expenditure as well as production approaches to estimating GDP changed between the new and old series.
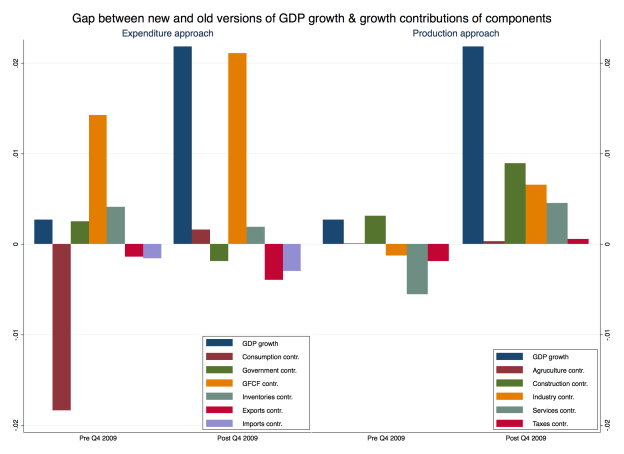
The left-hand graph makes it even more obvious how dominant investments (GFCF) were especially during the post-2009 era. At the moment, I only have breakdowns of investments for the post-2009 period, for construction, machinery & equipment, as well as an “others” category (which was not in the old series). Plotting the same graph for the expenditure GDP growth rate and component contributions but with more detailed GFCF components also illustrate the importance of construction investments, which drive almost the entire contribution to investments, and thus to the gap in (nominal) GDP growth between the new and old series.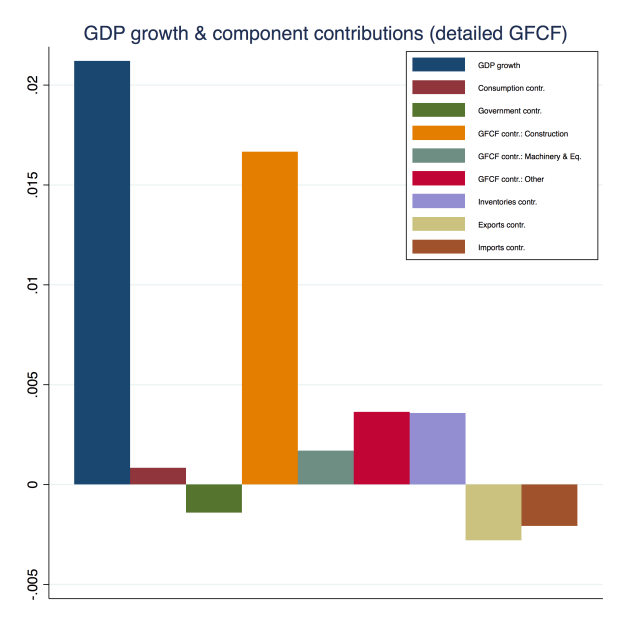
As for the gap in contributions to components from the production approach, the construction sector still contributed the most to explaining the gap in GDP growth between the new and old series, followed by the industry and services sectors. This suggests that most of the added contributions in these latter sectors are nonetheless related to construction investments (as opposed to those relating to new machinery & equipment).
The primacy of construction as a key driver of investment and growth in Turkey has a number of implications. One, it is a sector that tends to be particularly vulnerable during periods of economic crisis, evident from the figure with the GDP shares which shows construction decreasing particularly fast during the 2001 and 2009 crises. Thus, if internal or external factors would drive Turkey toward some form of crisis, it could be structurally more vulnerable than before. The construction sector is also a one particularly vulnerable to patronage and corruption (see here, here, and here) and in the southeast, urban development plans are intimately linked to the government’s controversial policies in resolving its conflict with the PKK. In addition, the construction sector is also plagued by low productivity growth internationally, as pointed out by a recent McKinsey study. It is also noteworthy that investments in construction seem to be driving changes in the added contributions to growth in non-constructions sectors on the production side.
The higher than previously reported GDP statistics, taken at face value, significantly improves Turkey’s economic track record. Yet it also confirms the concerns that the Turkish government has been pouring resources into sectors less conducive to sustainable growth and more susceptible to corruption or other factors plaguing the construction sector. As the departing World Bank country director in Turkey wrote a while back, “the transition to high income requires the evolution of rules from those that favor ‘know-who’ to those that favor ‘know-how’.” Not only from the institutional trajectory of Turkey more broadly, but also from the recent statistics revision coming out of Turkey, this seems less and less likely by the day.
