In the previous two posts on Turkey’s revised GDP statistics I showed 1) how revised GDP growth numbers diverge from the older version after 2009, 2) the importance of construction investments, and 3) how standard policy variables failed to explain the revised growth figures.
Especially the previous post used cross-sectional data to show that global relationships between policy variables failed to predict Turkish GDP growth. In this post I will take a more direct approach at trying to validate the new official GDP statistics using time-series variation in Turkey. To the extent that Turkey’s revised GDP numbers reflect variation in economic output, there ought to be alternative measures of real output varying in a similar fashion.
One option would be to compare Turkey’s GDP growth with that of a standard leading indicator like industrial production (IP) or retail sales, all three which are published by the Turkish Statistical Institute (Turkstat). Yet the point of the revision appears to have been to improve statistical collection capabilities by using expanded administrative record of firm activity and so on. In this case, any difference between such a series and GDP data could simply reflect differences between recently revised statistics and soon-to-be revised statistics. It is therefore preferable to seek measures of economic output that are less sensitive to changes in Turkstat’s statistical capacity.
The recent debate over the quality of GDP statistics in China is the starting point here. Leaked Wikileaks cables from 2007 showed the now premier of the state council suggesting three alternative measures of economic output instead of the official GDP data: electricity, rail freight volume, and bank loans. Below I make some adjustments to this in order to incorporate factors more specific to the Turkish growth model.
For starters, rail is not the dominant mode of transportation. And electricity is but one source of energy. Therefore, it makes sense to further include total energy consumption and to focus on total inland freight (which would also include road and sea freight). Emissions of carbon dioxide is another potentially industry-relevant predictor. And finally, in addition to the credit used to financed these investments, I’ll also include construction permits, both as a measure of construction activity as well as a leading indicator for economic output.
The rationale underlying the choice of the above measures is the following: Turkey’s higher growth numbers have been bolstered by construction investments (on the expenditure side) and both industry as well as construction output on the production side. Consequently, new infrastructure or buildings – evidenced by more construction permits – ought to require increased energy use as well as moving goods and workers from one place to another. The associated economic activity (the actual construction process as well as any following activity in the completed investment projects) should simultaneously also result in higher emissions of greenhouse gases.
For this blog post, I employ mainly the following eight variables (mostly in the form of growth rates):
- Industrial production index: not because it fits the purpose very well, as explained above, more as a reference to start with. The data is from Turkstat, available here.
- Primary Energy Consumption, in million tonnes of oil equivalent (mtoe), from the BP Statistical Energy Review.
- Electricity generation, in terrawatt-hours (TWh), from the BP Statistical Energy Review.
- Carbon dioxide emissions, in million tonnes, from the BP Statistical Energy Review.
- Total inland passenger traffic, in million passenger-kilometers, from OECD.
- Total inland freight, in million tonnes-kilometers, form OECD.
- Total bank loans, in CPI-deflated Turkish lira, from the Central Bank of Turkey
- Construction permits, in CPI-deflated Turkish lira, from Turkstat
At first, we would like to make sure the above variables are able to predict any of the Turkish GDP growth before 2010 – the breakpoint after which the new and old GDP series diverge.
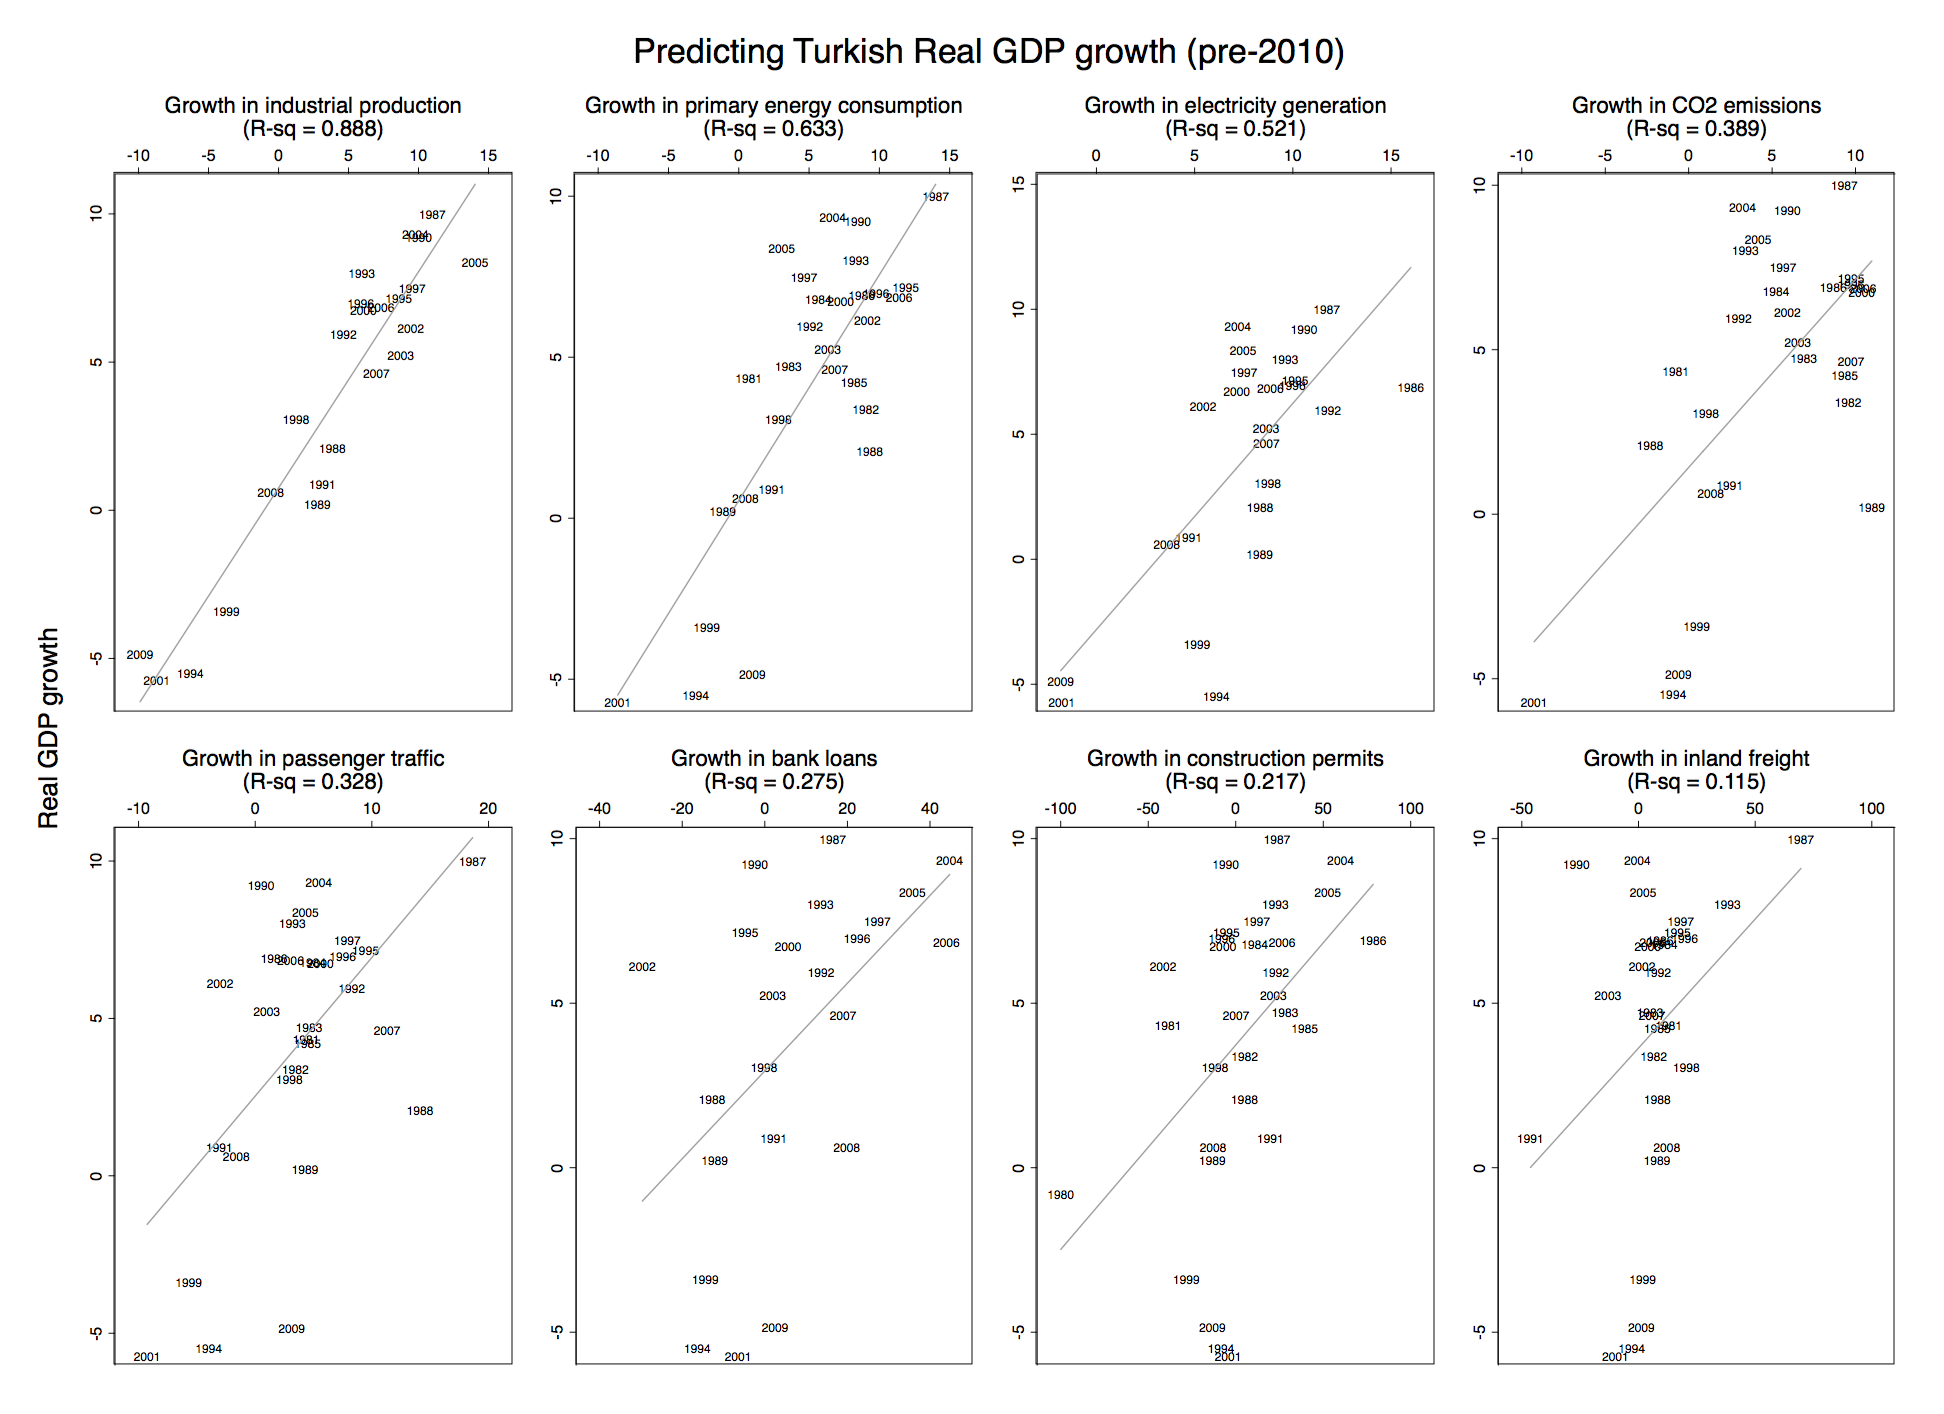
The panels are ordered by how well they predict annual growth in Turkish GDP. IP has the highest R-squared at roughly 0.9 – unsurprising, as it’s likely drawn from very similar data as GDP and so less useful for my purposes here. Still, both energy use and electricity consumption predict a significant share – 63 and 50 percent respectively – of the variation in growth. Interestingly, the worst predictor is inland freight.
That said, overall these variables appear to do a fairly decent job of predicting real GDP growth. So how have they fared when comparing their growth rates during the periods 2004-2009 and 2010-2015, i.e. the two six-year periods before and after 2009/2010 in Turkey which I focused on in the previous post?
Below, I show how the growth rates from the energy-related outcomes stacks up against GDP growth (again, this is all Turkey-only data):

In the earlier period, most energy measures appear to grow at roughly the same rate per year as real GDP (although electricity generation is 1.2-1.5 percentage points higher). In the later period, although new and old series of real Turkish GDP both grow faster than the energy-related measures, it’s really the new GDP series that stands out, with a growth rate between 2.5-4.1 percentage points higher than the other measures. Most energy growth measures are also lower in the later period which would suggest lower, not higher, GDP growth in 2010-2015 compared to 2004-2009.
Thus, compared to the measures that explain the most of the variation in Turkish GDP (bar the IP measure), Turkey’s reported GDP growth is significantly higher than what alternative industry-related measures suggest. This is awkward, as we would expect extensive investments in construction to be more visible in these measures. It’s hard to believe that Turkey has undergone substantial energy efficiency to explain the difference in growth rates, especially when its annual power transmission losses as a share of output has remained at roughly 60-70% higher than the average among upper middle income countries. There has been some uptick in the use of renewable energy in Turkey, but it’s doubtful that this would have expanded as quickly as construction activity in the most recent years.
Below, I show the growth rates for freight and passenger transport.
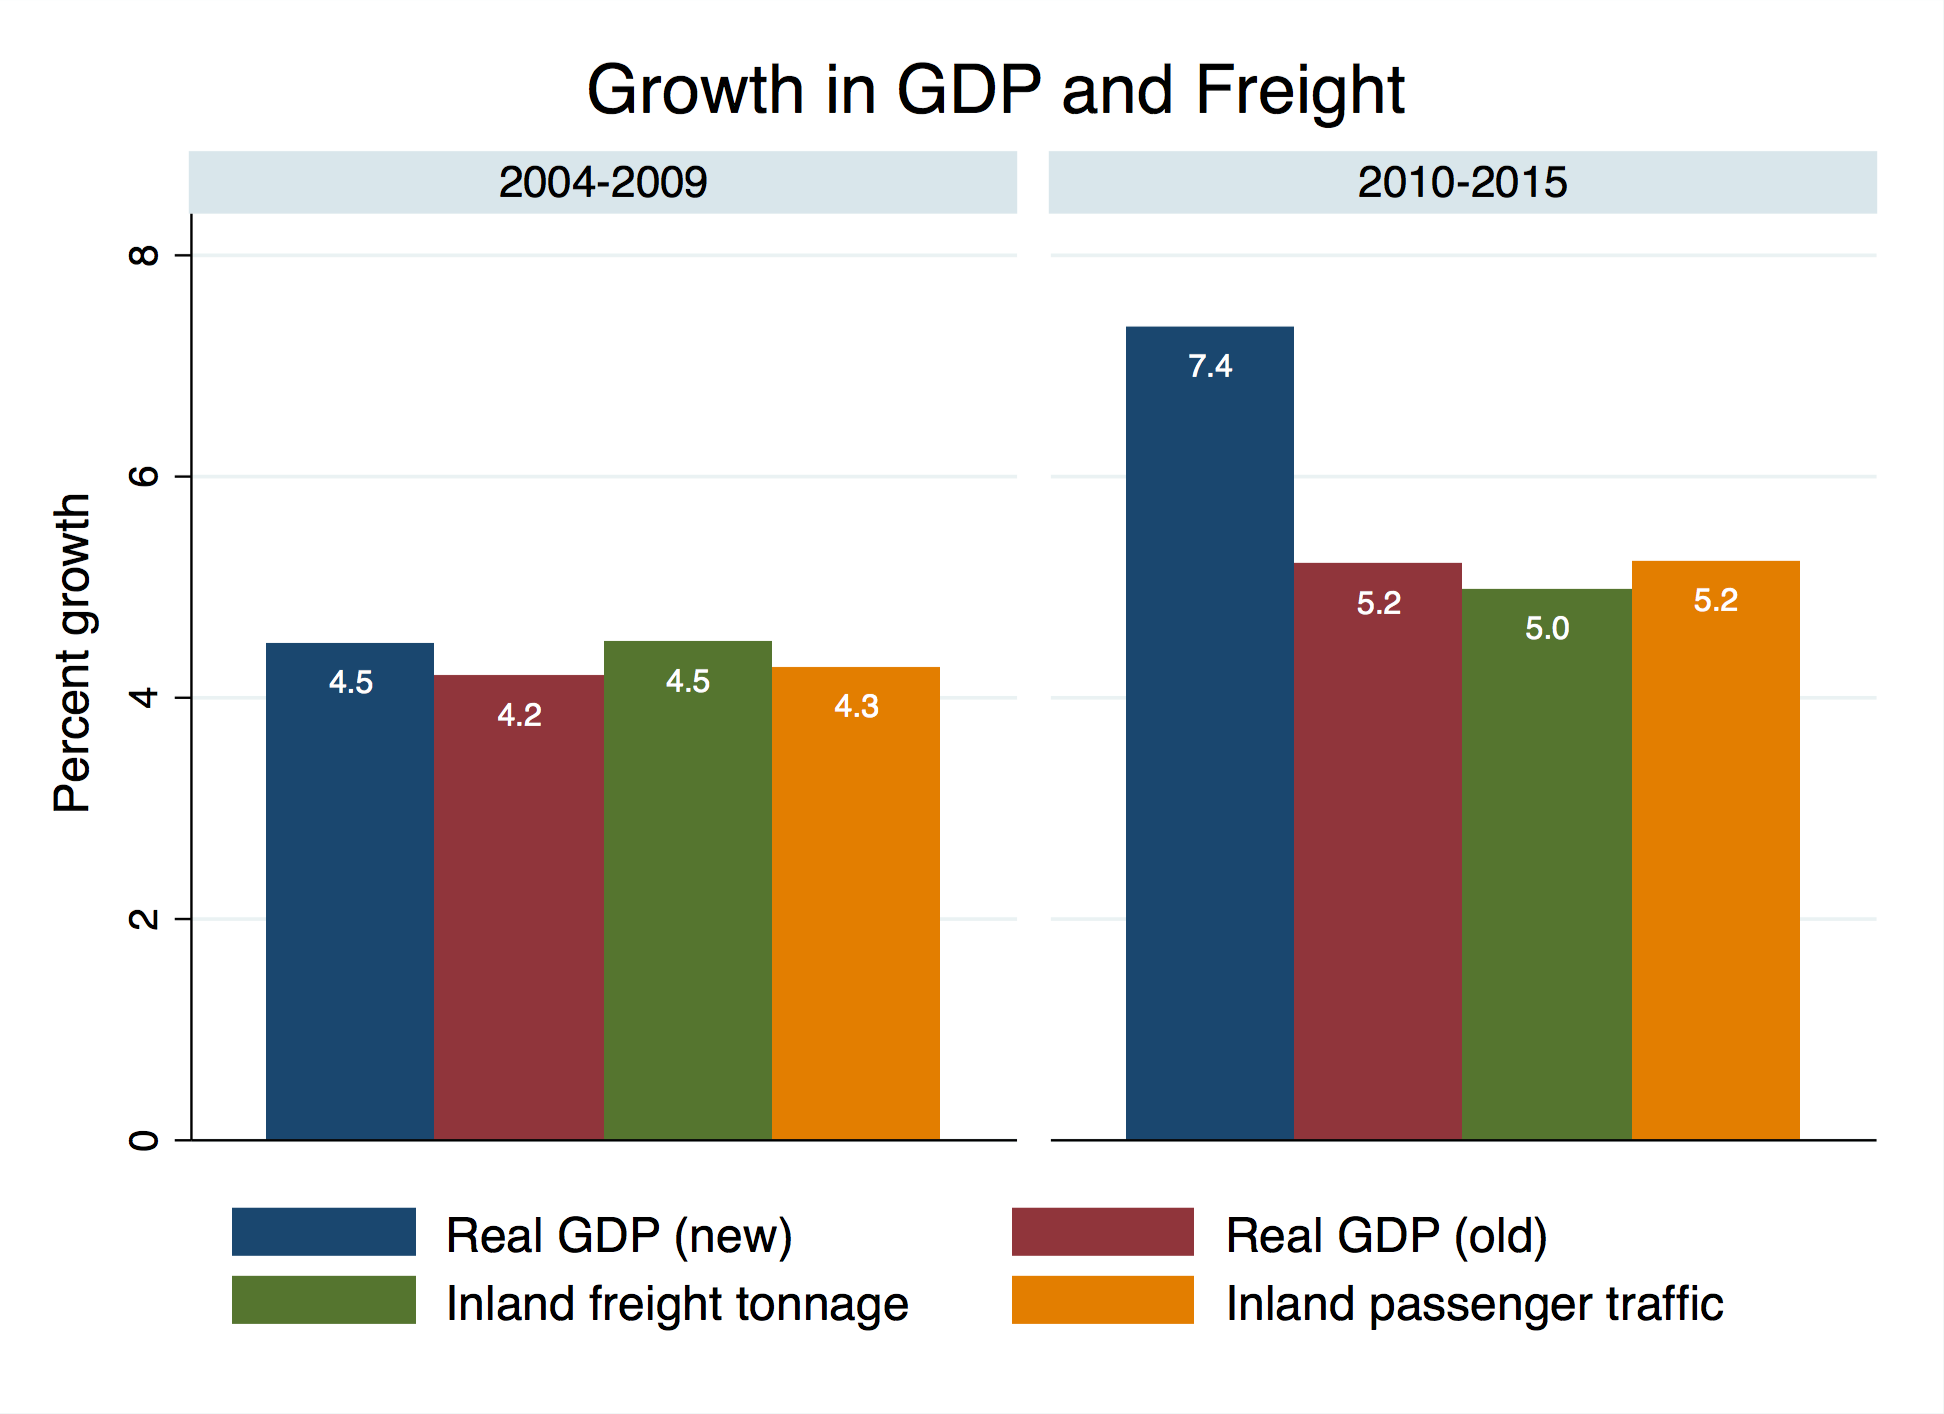
This shows largely the same picture as the energy measures, with real GDP growing neck-to-neck with both freight and passenger traffic in 2004-2009 only to diverge substantially in the period 2010-2015.
The comparison with bank loans and construction permits below shows different levels to start with (these two have grown much faster than GDP in both periods) but in both cases their growth rates are nonetheless lower in the later period where revised GDP growth, in contrast, is much higher. This is also rather odd. We would have expected higher credit growth and higher growth in construction permits to be associated with higher real GDP growth, not the opposite.

Comparing these series to GDP growth one-by-one is illustrative to some extent but we might also want to use them to simultaneously predict what GDP growth ought to be.
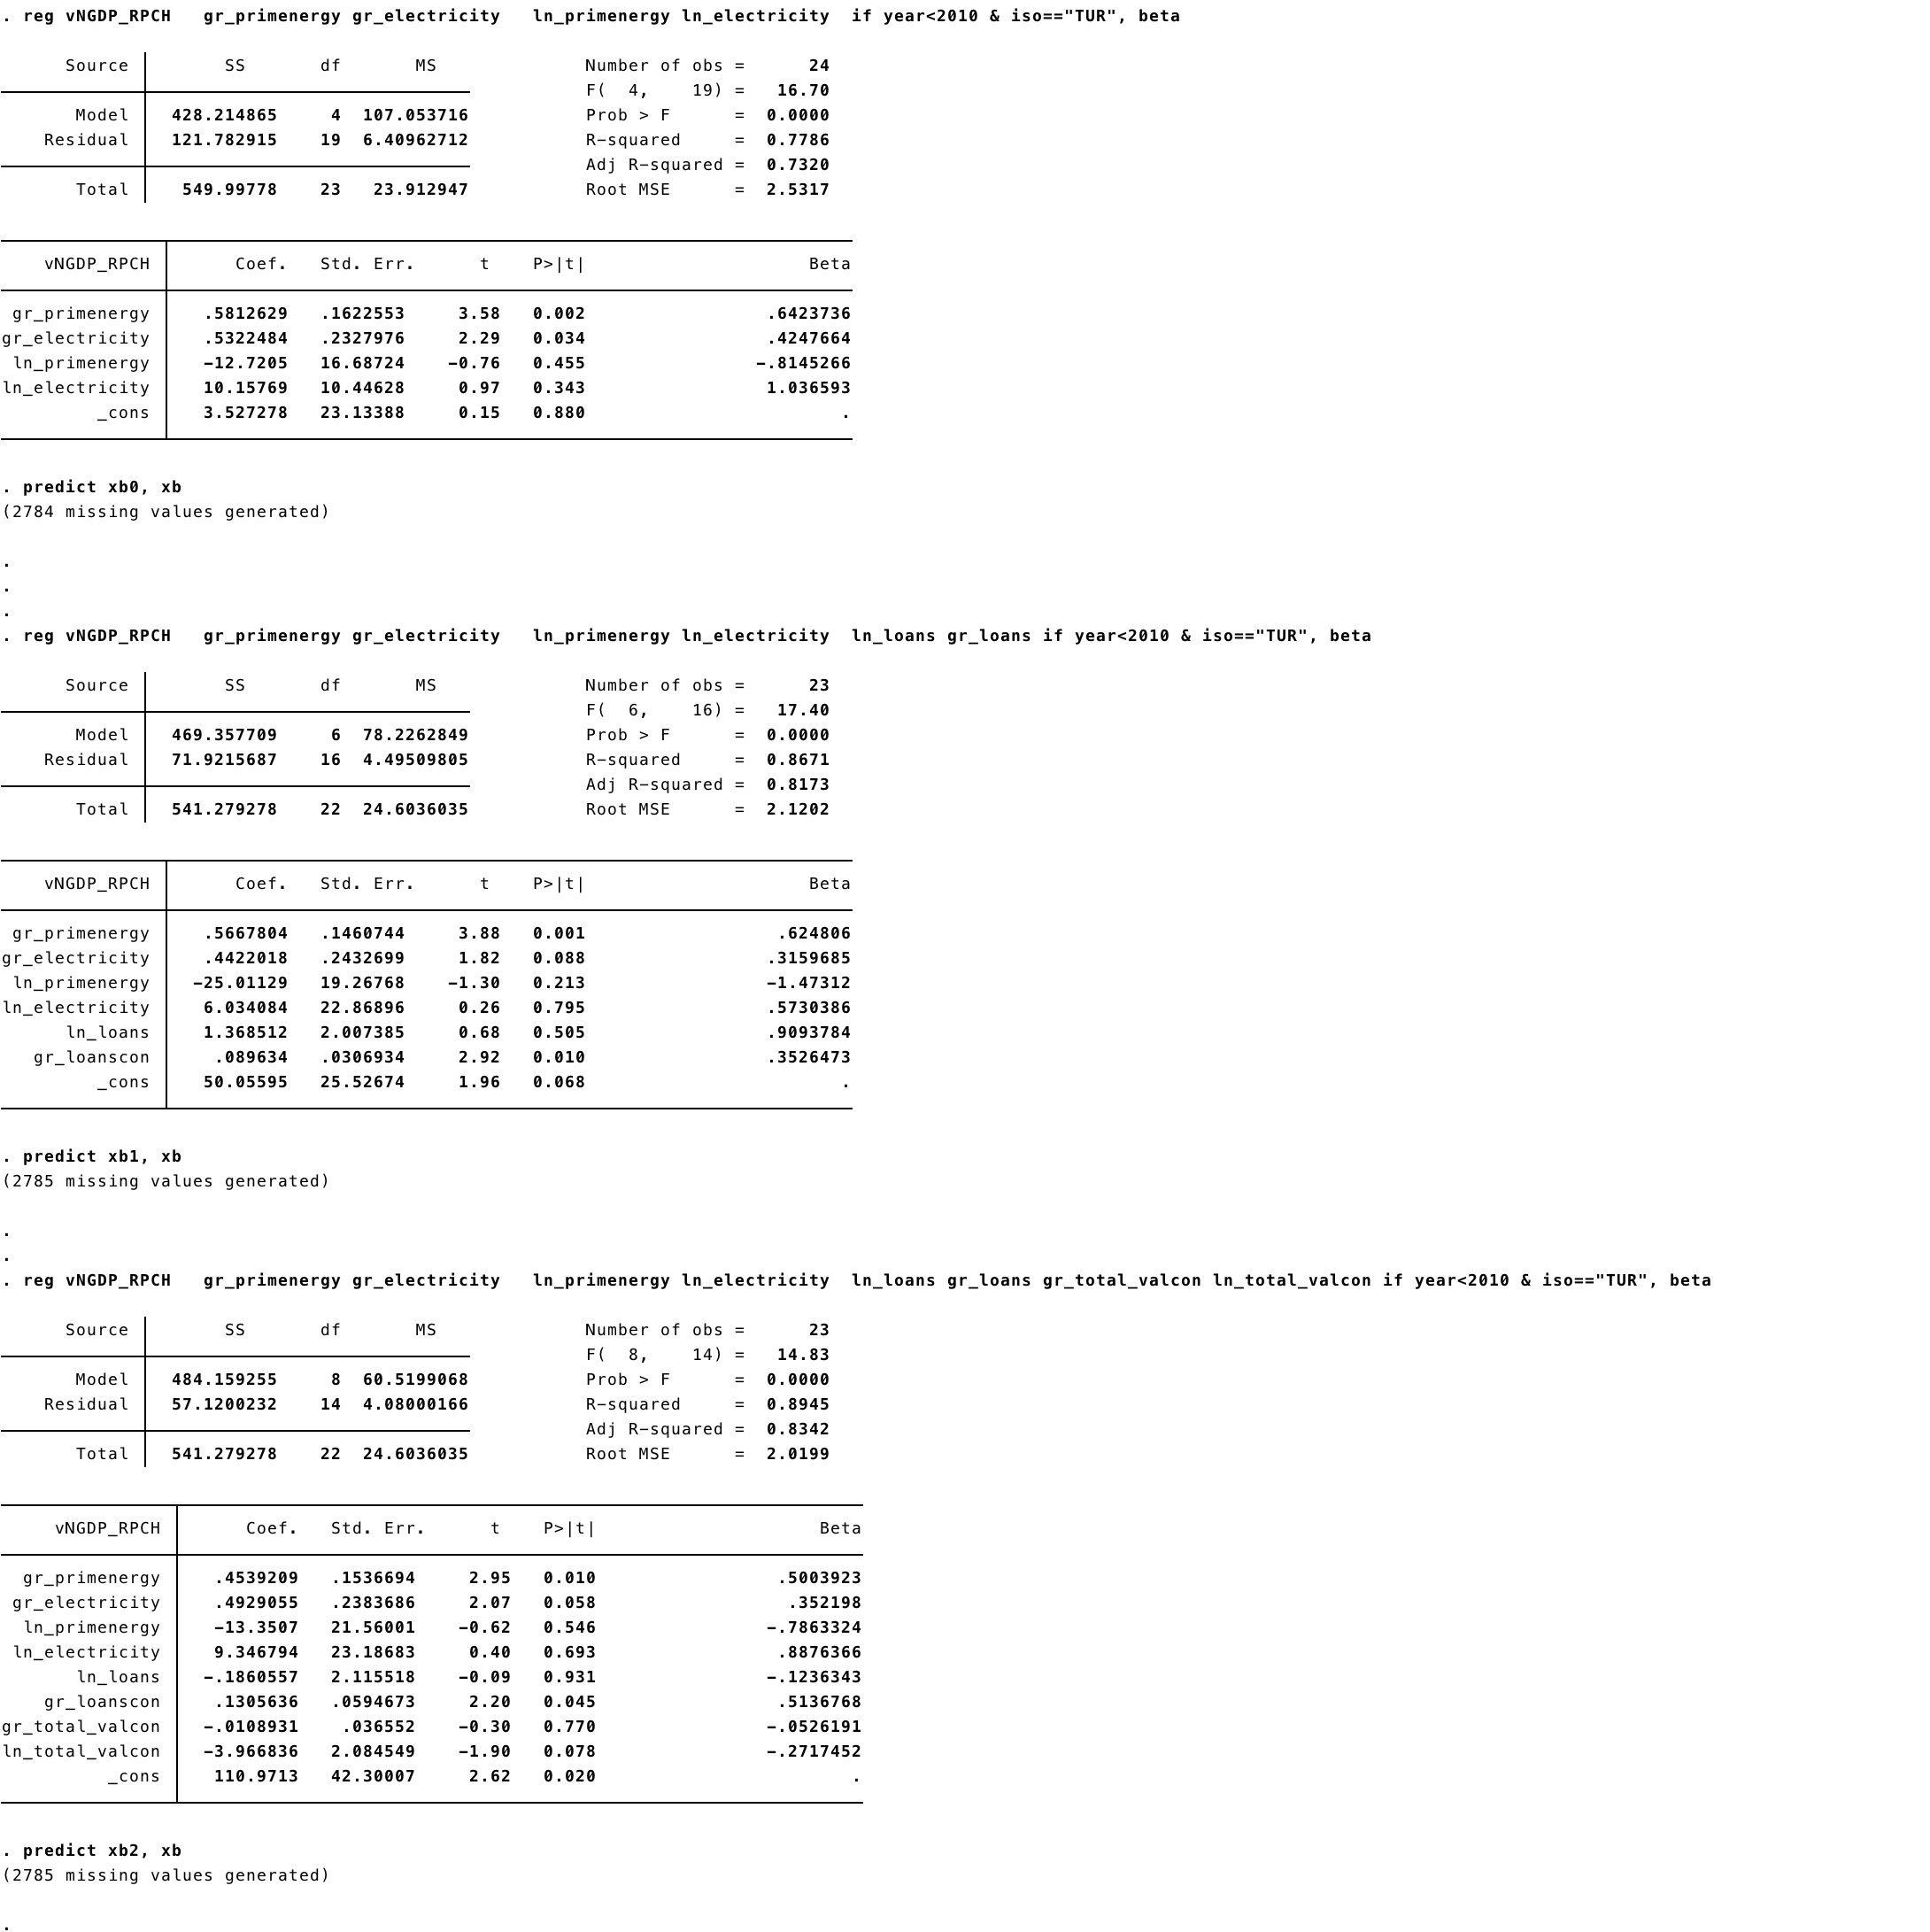
For this purpose I first regress annual real GDP growth on annual growth rates for a subset of the above measures during the period 1981-2009: the first model includes, on the right-hand side, annual growth rates in primary energy consumption and electricity generation (as well as the natural logarithms of their values); the second model adds the growth rate and log level of bank loans; and the third model further adds the growth and log level of construction permits. Omitted from this regression are the freight and passenger as well as the carbon dioxide measures, as it turns out that these have very little value in predicting GDP growth ones the other measures are included. (Including them changes nothing, it just eats additional degrees of freedom). The three models explain (have R-square values of) around 73, 82, and 83 % of the variation in GDP growth respectively during 1981-2009 (regression output is here).
I then use this model to predict out-of-sample Turkey’s GDP growth rate in the years 2010-2015 respectively. The average growth rates for the official data as well as those predicted from the three models are shown below.

Unsurprisingly, the model does a good job of predicting GDP growth during 2004-2009, but more interesting is that these composite regression models predict much lower growth rates than indicated by the new GDP figures from Turkstat. The three different models predict Turkey growing at around 4.1-7.5 percentage points lower than the most recent official series. In particular, the third model predicts Turkey’s GDP remaining entirely stagnant at on average zero growth between 2010-2015.
Curiously, in the previous post, the policy model I estimated predicted Turkey’s growth in GDP (per capita) to be roughly 4.5 percentage points lower than the revised official data. Thus, two very different methods of predicting growth in Turkish economic output suggest significantly lower growth rates than official data indicates.
Perhaps there are other measures of economic activity than the ones I have included that do a better job at explaining why the recently revised real GDP statistics coming out of Turkey shows such high growth rates during recent years. Yet even if there are such variables, it is rather odd that a Turkey’s phenomenal on-paper transformation from ‘Lounging House Cat’ to ‘Roaring Tiger’ cannot be discerned in commensurate growth dynamics with regards to energy consumption, carbon dioxide emissions, freight, passenger traffic, bank loans, or construction permits. Specifically, the former four tend to trace the old series’ lower GDP growth rates rather closely, and the latter two exhibit higher growth rates when GDP growth is lower and vice versa. Altogether, these variables predict GDP growth rates that are far below that of the official releases. At the very least, this ought raises some serious issues about the sustainability of economic growth in Turkey.
In conclusion, I have but one question: Will the real real GDP in Turkey please stand up?
